Что такое альтсезон?

Что такое японские свечи


Мышление богатых

Финансовая грамотность: что это такое и как стать финансово грамотным
Что из себя представляет плановая экономика?
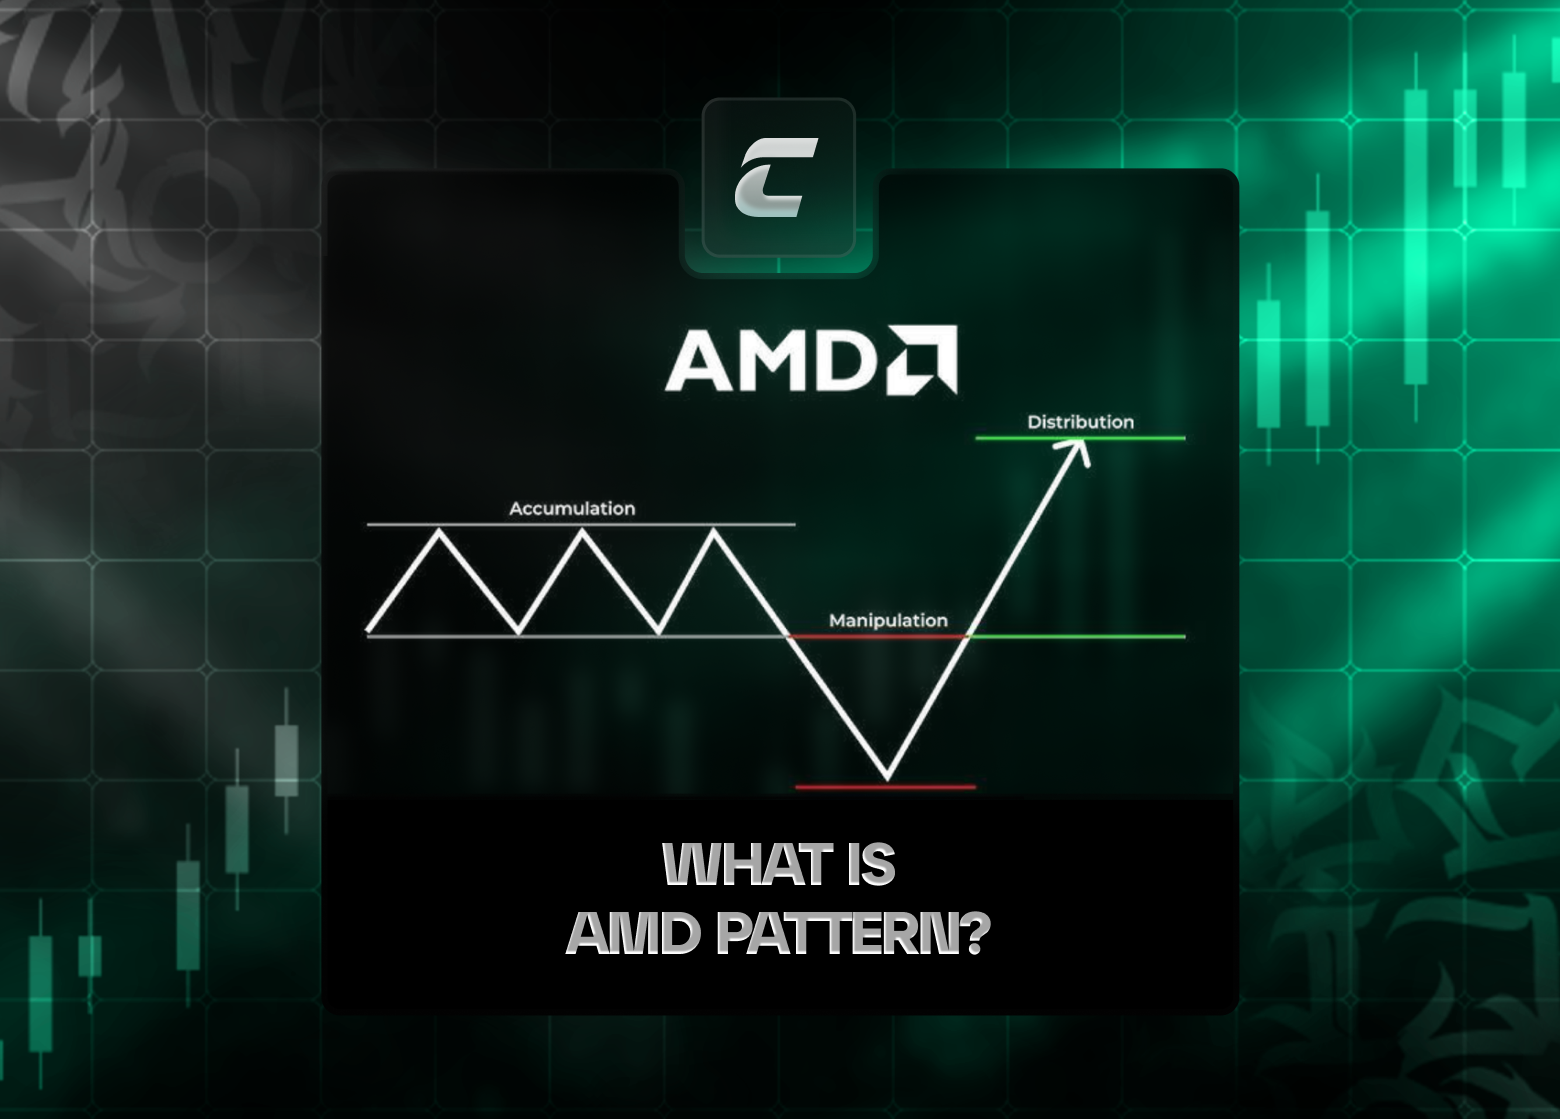
Что такое AMD?


РЕЗУЛЬТАТЫ WORKSHOP V.9

Недельный план - 13.01 - 17.01.2025
Что такое SocialFI?

Что такое Fed rate?
Что привело к появлению криптовалют?
2024 Recap: подводим итоги, смотрим на результаты и строим новые цели