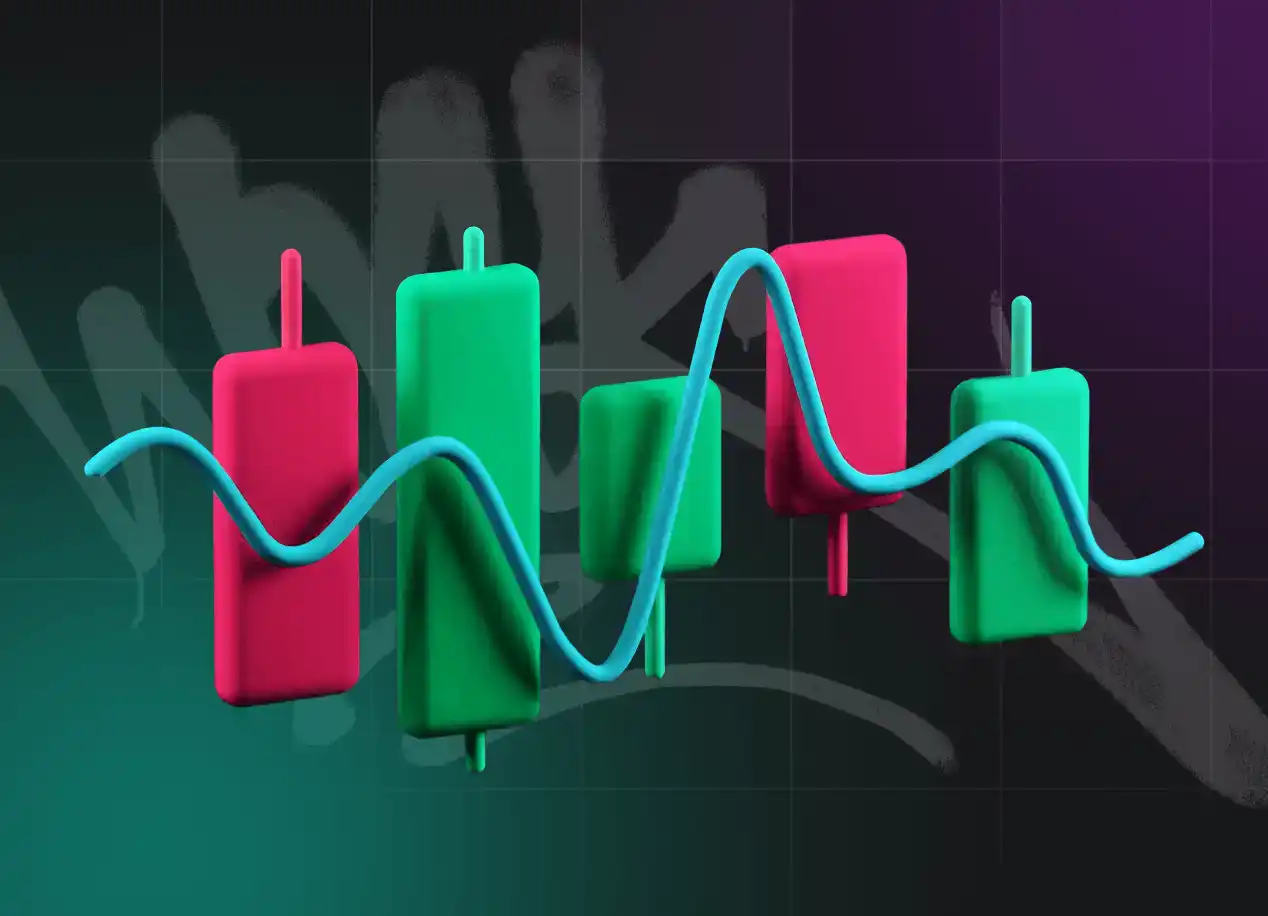
Японские свечи - это один из наиболее популярных методов анализа цен на финансовых рынках. Они представляют собой графическое представление ценовой активности в определенном периоде времени.
Каждая японская свеча имеет два основных компонента - тело свечи и ее тени. Тело свечи показывает разницу между ценой открытия и закрытия актива за определенный период времени. Если тело свечи заполнено или закрашено, это обычно означает, что цена закрытия ниже цены открытия, и это может указывать на снижение цены. Если тело свечи не заполнено или оставлено прозрачным, это обычно означает, что цена закрытия выше цены открытия, и это может указывать на повышение цены.
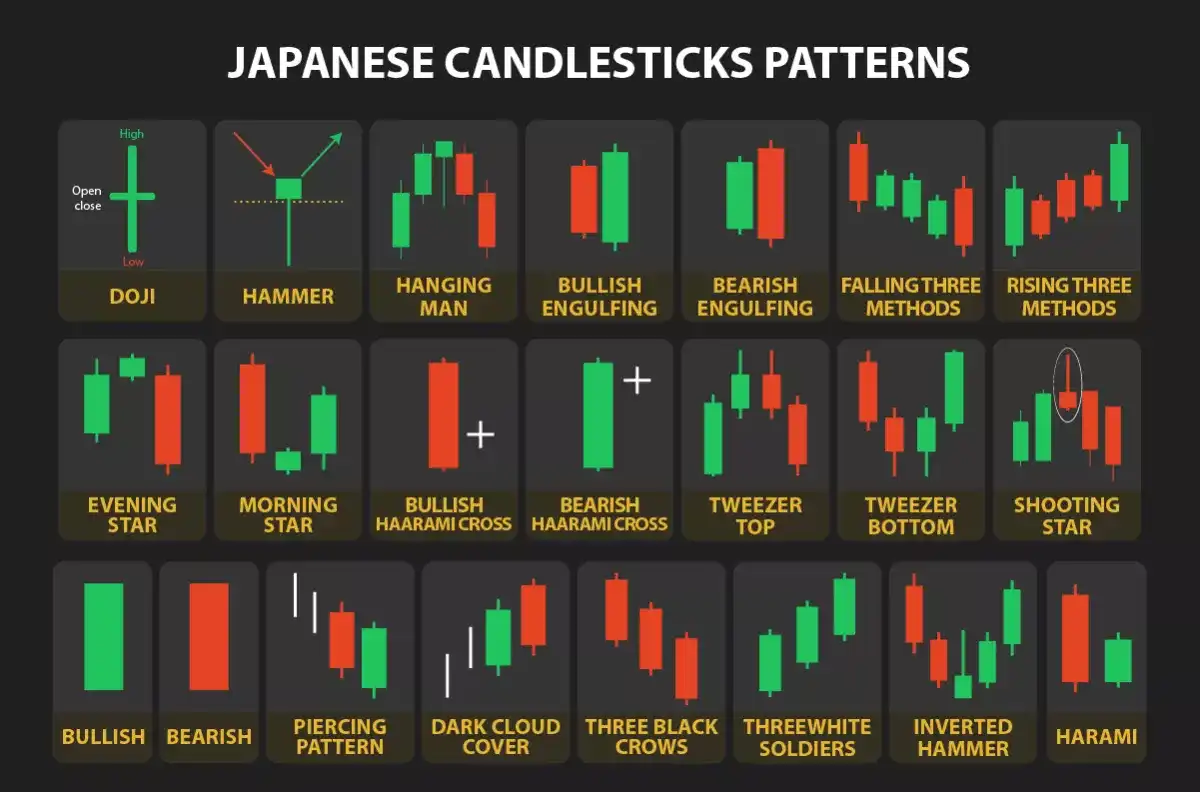
Японские свечи могут быть использованы для определения различных паттернов и сигналов, которые помогают предсказывать будущие движения цен. Например, существуют различные паттерны свечей, такие как "Молот", "Вечерняя Звезда", "Медвежье поглощение" и другие, которые могут указывать на возможное изменение тренда.
Использование японских свечей в анализе цен может помочь трейдерам принимать обоснованные решения о входе или выходе из сделок. Однако для начинающих трейдеров важно осознавать, что анализ японских свечей требует практики и опыта. Рекомендуется изучать различные паттерны свечей, их значения и их применение в сочетании с другими инструментами анализа.
.webp)
История появления японских свечей
Японские свечи были созданы в Японии в XVIII веке для отслеживания цен на рынках риса. Тогда японские торговцы рисом использовали простую систему для мониторинга цен, но она не была достаточно эффективной.
Рынок риса, который изначально возник на торговом дворе Йодои, был официально признан в конце XVII века с появлением Рисовой биржи Дожима в Осаке. До 1710 года на бирже продавался сам рис. После 1710 года на бирже стали выпускаться и обращаться рисовые купоны – первые в истории фьючерсные контракты.
Рисовая биржа стала основой экономического расцвета Осаки, где работало более 1300 торговцев рисом. В то время в Японии не существовало единой валюты (предыдущие попытки ввести стабильную валюту провалились из-за ее быстрого обесценивания), поэтому мерой обмена фактически стал рис. Рисовые купоны активно обращались на бирже, продаваясь под будущие урожаи, и стали первыми фьючерсными контрактами. Рисовая биржа Дожима, где ими торговали, стала первой фьючерсной биржей в мире.
В такой экономической обстановке начал свою деятельность Мунехиса Хомма, которого позже прозвали «королем рынков». Он был одним из первых, кто начал предсказывать будущее движение цен на основе прошлых данных.
Именно ему приписывают разработку метода свечных графиков, который быстро завоевал популярность в Японии и впоследствии распространился по всему миру.
В 1990-х годах популярность японских свечей значительно возросла благодаря книге Стива Нисона, который познакомил западную аудиторию с этой техникой. Сегодня японские свечи широко используются в анализе и являются популярным инструментом среди трейдеров и инвесторов на различных финансовых рынках.
Свечи на графике визуально различаются между бычьими (рост цены) и медвежьими (падение цены) периодами.
Бычьи свечи обычно изображаются белыми или зелеными и обозначают периоды, когда цена закрытия выше цены открытия.
Медвежьи свечи, напротив, окрашиваются в черный или красный цвет и показывают, что цена закрытия ниже цены открытия.
.webp)
Элементы японской свечи
Японская свеча визуально делится на тело и фитиль (тень). Тело свечи является прямоугольником между ценой открытия и закрытия – оно показывает основное движение цены за период.
Тени свечи, или "фитили", отображают экстремальные значения цен – максимумы и минимумы за данный период.
Длина тела и теней свечи может рассказать трейдерам многое о рыночной динамике.
Большое тело свечи указывает на сильное движение цены и активность участников рынка. Если тело свечи длинное и белое (зеленое), это означает, что цена значительно выросла с момента открытия до момента закрытия, и покупатели доминировали на рынке. Такое сильное бычье движение может сигнализировать о продолжении восходящего тренда и уверенности участников рынка в дальнейшем росте.
С другой стороны, длинное тело черной (красной) свечи указывает на значительное снижение цены, что означает, что продавцы взяли верх и продавили цену вниз. Это может свидетельствовать о продолжении нисходящего тренда и усилении медвежьих настроений на рынке.
Короткое тело свечи, независимо от цвета, указывает на небольшое изменение цены между открытием и закрытием. Это может означать нерешительность рынка, когда ни покупатели, ни продавцы не смогли взять верх. Такие свечи, особенно если они повторяются, могут предвещать возможное изменение тренда или фазу консолидации.
Длинные тени указывают на значительные ценовые колебания в течение торгового периода. Например, длинная верхняя тень показывает, что цена поднималась значительно выше цены закрытия, но затем снизилась к концу периода. Это может свидетельствовать о том, что продавцы взяли верх над покупателями, и рынок испытал давление со стороны предложения. Длинная нижняя тень, напротив, указывает на то, что цена падала значительно ниже цены закрытия, но затем восстановилась, что может свидетельствовать о силе покупателей и поддержке на более низких уровнях цен.
Короткие тени указывают на то, что ценовые колебания в течение периода были относительно незначительными и цена не отклонялась далеко от уровней открытия и закрытия. Это может свидетельствовать о спокойном и стабильном рынке без значительных покупок или продаж.
Тени свечей также играют важную роль в идентификации различных свечных паттернов, которые могут сигнализировать о возможных разворотах или продолжениях тренда.
Как читать японские свечи
Чтение японских свечей - это важный навык, который помогает трейдерам анализировать ценовую активность на финансовых рынках. Вот несколько простых шагов, которые помогут вам начать читать японские свечи:
- Определите основные элементы свечи: каждая японская свеча состоит из тела и теней. Тело свечи представляет собой прямоугольную форму и показывает разницу между ценой открытия и закрытия за определенный период времени. Тени свечи представляют собой линии, выходящие из тела свечи, и показывают экстремальные значения цены за этот период.
- Узнайте значения цвета свечей: в зависимости от вашего выбранного графика, свечи могут быть закрашены разными цветами. Если тело свечи заполнено или закрашено, обычно это означает, что цена закрытия ниже цены открытия, и это может указывать на снижение цены. Если тело свечи остается прозрачным или не заполняется, это обычно означает, что цена закрытия выше цены открытия, и это может указывать на повышение цены.
- Обратите внимание на длину теней: длина теней свечей может дать вам информацию о волатильности рынка и силе покупателей или продавцов. Если верхняя тень длиннее, это может указывать на сильное сопротивление уровню цены, а если нижняя тень длиннее, это может указывать на сильную поддержку уровня цены.
- Изучите паттерны и сигналы свечей: существуют различные паттерны и сигналы, которые могут возникать на графиках свечей. Некоторые из них включают "Молот", "Вечерняя Звезда", "Медвежье поглощение" и другие. Узнайте о различных паттернах и их значениях, чтобы уметь распознавать их на графиках.
- Используйте другие инструменты анализа: чтение японских свечей лучше всего комбинировать с другими инструментами анализа, такими как трендовые линии, поддержка и сопротивление, индикаторы и другие. Это поможет вам получить более полное представление о ценовой активности и принять более информированные решения.
Важно понимать, что чтение японских свечей требует практики и опыта. Рекомендуется изучать различные паттерны свечей, анализировать их значения и применять их в сочетании с другими инструментами анализа для более точных результатов. Постепенно вы будете развивать свои навыки чтения японских свечей и использовать их в своей торговле на финансовых рынках.
.webp)
Паттернов, состоящих из японских свечей, существует огромное количество. Какие-то из них более эффективные, какие-то менее. Однако, главное, чтобы вы помнили, что они не должны быть единственной причиной в вашем предубеждении для открытия позиции. Такие свечные модели следует использовать исключительно в совокупности с другими инструментами анализа.
Основные модели японских свечей
Одиночные свечные модели
Это одни из самых простых паттернов, которые можно увидеть на графике. Они формируются всего за один торговый период. Часто эти одиночные свечи служат основой для более сложных и продолжительных паттернов.
Волчок
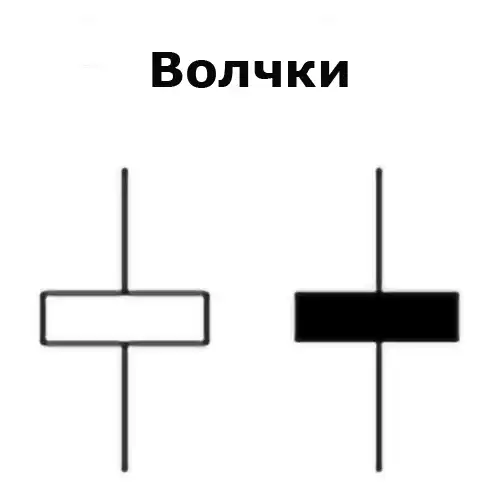
В отличие от большинства свечных моделей, для "волчка" не имеет значения, будет свеча черной (красной) или белой (зеленой) – важны только наличие небольшого тела и длинного фитиля.
Когда на графике образуется “волчок”, происходит своего рода перетягивание каната между покупателями и продавцами. Однако медведи и быки уравновешивают друг друга, поэтому значительного движения цены не происходит.
Как правило, трейдеры воспринимают "волчки" как признак ослабления текущего тренда. Если такая свеча появляется после длительного бычьего роста, это может свидетельствовать о том, что позитивные настроения на рынке начинают угасать. В то же время, если "волчок" формируется после нисходящего тренда, это может означать, что бычьи настроения начинают набирать силу.
Marubozu
Marubozu происходит от японского слова "лысый". Этот термин описывает свечу без фитилей.
Белый (зеленый) marubozu открывается на самом низком уровне и закрывается на самом высоком уровне. Белый (красный) marubozu открывается на самом высоком уровне и закрывается на самом низком уровне.
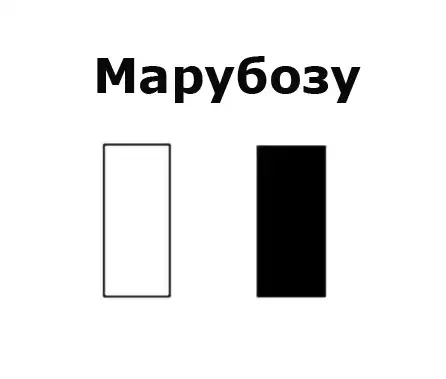
Если представить движение цен в рамках белого (зеленого) marubozu, то не будет никаких ценовых действий выше или ниже уровней открытия и закрытия.
Таким образом, белая (зеленая) "лысая" свеча является индикатором сильных бычьих настроений. Быки толкают цену вверх, а медведи практически не оказывают сопротивления.
Когда это происходит в рамках восходящего тренда, трейдеры воспринимают это как признак продолжения роста. Если же такое движение происходит после нисходящего тренда, это может указывать на возможный разворот.
Черные (красные) marubozu, напротив, показывают полное доминирование медведей. Это свидетельствует о том, что медведи контролировали весь период торгов, что может указывать на продолжение нисходящего тренда или разворот восходящего тренда.
Doji (Доджи)
В паттерне доджи цены открытия и закрытия равны или почти равны, поэтому тело фигуры выглядит как очень тонкая линия, обычно составляющая менее 5% от общего диапазона движения цены за период, скрытый в свече.
Как и при волчках, это может указывать на то, что к концу сессии быки и медведи уравновесили друг друга.
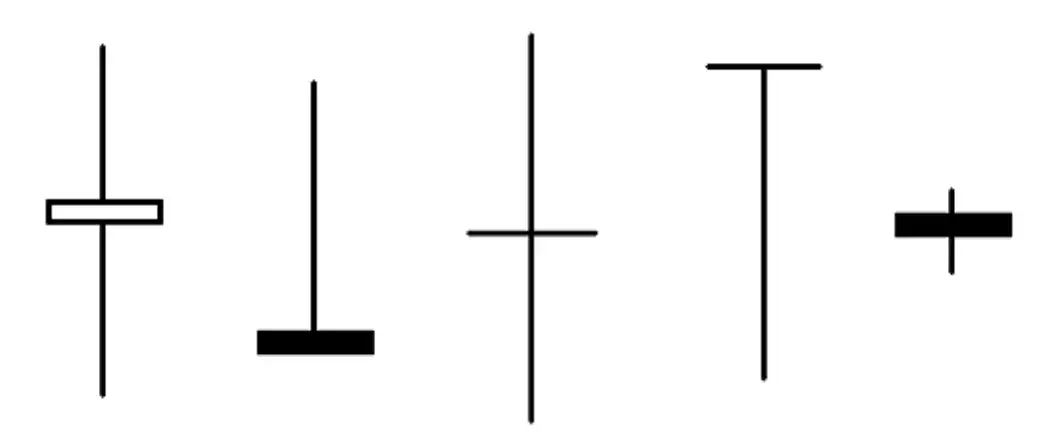
Существует четыре основных типа доджи, которые стоит учитывать:
- Длинноногие доджи имеют длинный фитиль как над, так и под телом.
- Могильные доджи имеют высокий фитиль над телом и отсутствуют под ним.
- Стрекоза доджи имеет длинный фитиль под телом и практически не имеет фитиля над ним.
- Четырехценовые доджи не имеют фитилей вообще.
Доджи часто рассматриваются как сигнал возможного разворота. Если такой паттерн формируется после продолжительного восходящего тренда, это может означать, что рынок собирается повернуть вниз. После медвежьего движения – это может указывать на исчерпание сил продавцов и возможность того, что быки скоро возьмут верх.
Молот и повешенный
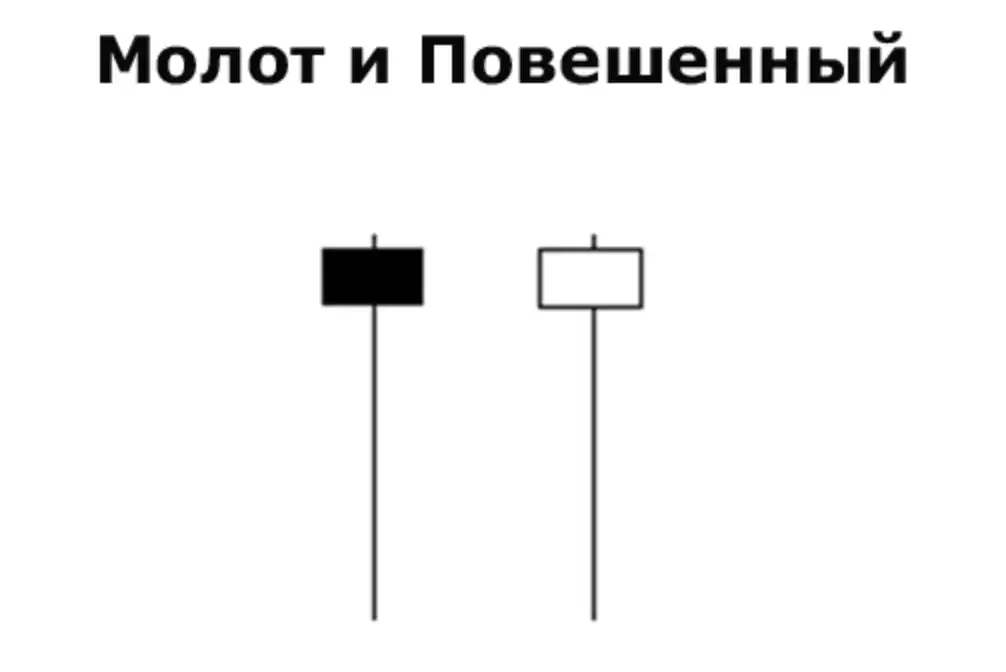
Отдельно взятые такие свечи являются абсолютно одинаковыми, однако все зависит от того, какой тренд им предшествовал.
Обе свечи характеризуются небольшими телами, длинными нижними тенями и отсутствием верхних теней, хотя на практике и допускается наличие коротких верхних теней.
Молот представляет собой модель бычьего разворота, формирующуюся в контексте нисходящего тренда. Трейдеры часто воспринимают молот как сигнал того, что рынок достиг "дна" и скоро начнется восходящее движение.
Молот можно узнать по длинному нижнему фитилю под сравнительно коротким телом, над которым фитиль практически отсутствует. Тело должно быть в два-три раза короче нижнего фитиля. Это указывает на то, что рынок достиг нового минимума в течение сессии, но затем отскочил и закрылся значительно выше. Таким образом, несмотря на сильное давление со стороны продавцов, покупатели смогли оттеснить медведей до закрытия.
Хотя медвежьи настроения ослабевают, это не обязательно означает неизбежный разворот. Поэтому большинство трейдеров ждут подтверждения перед открытием позиции на основании молота – обычно это сильное восходящее движение в следующем периоде.
Повешенный представляет собой модель, указывающую на возможный медвежий разворот. Появление такой свечи на фоне восходящего тренда может свидетельствовать о том, что рынок столкнулся с сильным уровнем сопротивления, и что продавцы начинают доминировать над покупателями.
Длинная нижняя тень показывает, что медведи активно пытались снизить цену. Покупатели вмешались, но смогли лишь закрыть цену около уровня открытия, не добившись значительного успеха.
Перевернутый молот и падающая звезда
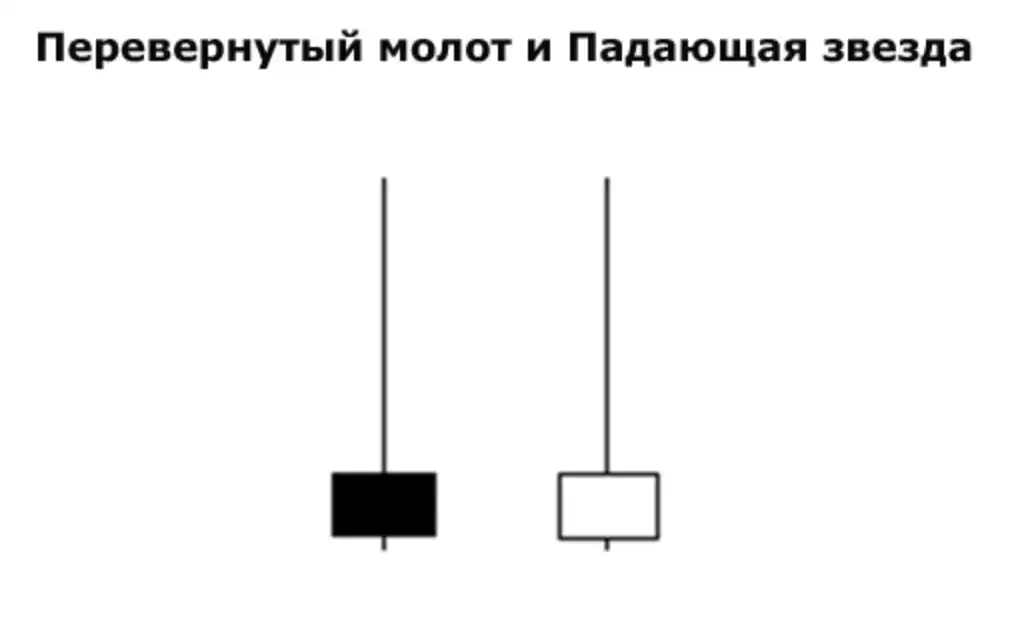
Перевернутый молот появляется в контексте нисходящего тренда и сигнализирует о потенциальном бычьем развороте. Внешне перевернутый молот имеет длинную верхнюю тень и маленькое тело внизу свечи, при этом нижняя тень либо отсутствует, либо очень короткая. Такая форма свечи показывает, что покупатели попытались поднять цену в течение торговой сессии, но в конечном итоге не смогли удержать свои позиции. Тем не менее, факт того, что цена поднялась в течение сессии, указывает на возможное ослабление давления продавцов и начало изменения настроений рынка. Если после перевернутого молота появляется свеча с более высоким закрытием, это подтверждает сигнал о развороте и укрепляет уверенность в начале восходящего тренда.
Падающая звезда, напротив, является моделью медвежьего разворота и появляется после восходящего тренда. Внешне она похожа на перевернутый молот, но формируется на вершине восходящего тренда. Падающая звезда также имеет длинную верхнюю тень и маленькое тело внизу свечи с нижней тенью, которая либо отсутствует, либо очень короткая. Длинная верхняя тень показывает, что покупатели пытались продолжить поднимать цену, но продавцы взяли верх и продавили цену вниз к концу сессии. Появление падающей звезды сигнализирует о том, что восходящий тренд ослабевает и возможно начало нисходящего тренда. Если после падающей звезды появляется свеча с более низким закрытием, это подтверждает сигнал о медвежьем развороте и усиливает уверенность в начале нисходящего тренда.
Двойные свечные модели
Поглощение
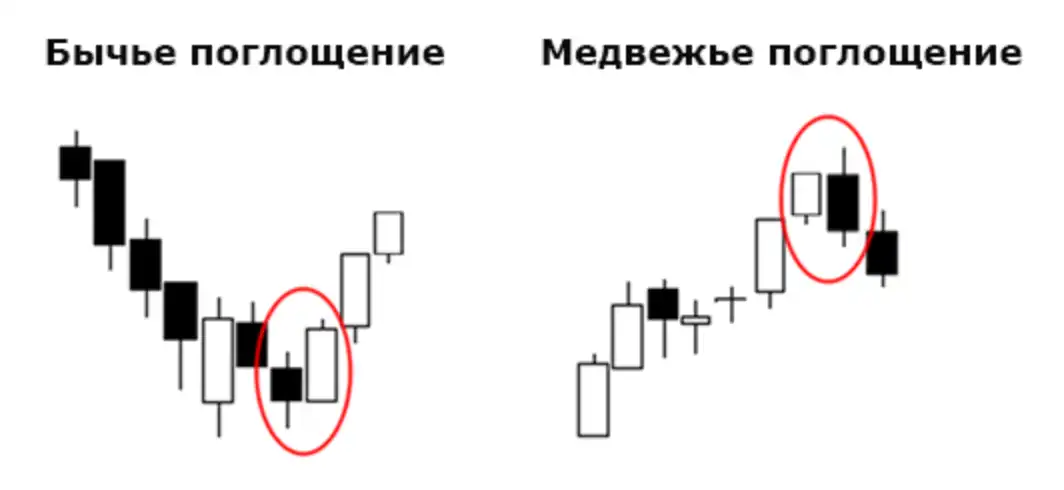
Существует два типа паттерна поглощения: бычье поглощение и медвежье поглощение.
Бычье поглощение возникает после нисходящего тренда и сигнализирует о возможном начале восходящего движения. Внешне этот паттерн состоит из двух свечей: первая свеча маленькая и медвежья, а вторая свеча большая и бычья. Вторая свеча полностью поглощает тело первой свечи, что означает, что ее цена открытия ниже, а цена закрытия выше, чем у предыдущей медвежьей свечи. Это показывает, что покупатели взяли контроль над рынком, перекрыв предыдущие продажи. Появление бычьего поглощения может свидетельствовать о том, что нисходящий тренд закончился и начался восходящий тренд.
Медвежье поглощение, напротив, появляется после восходящего тренда и указывает на возможное начало нисходящего движения. Этот паттерн также состоит из двух свечей: первая свеча маленькая и бычья, а вторая свеча большая и медвежья. Вторая свеча полностью поглощает тело первой свечи, что означает, что ее цена открытия выше, а цена закрытия ниже, чем у предыдущей бычьей свечи. Это указывает на то, что продавцы взяли верх над покупателями, перекрыв предыдущие покупки. Появление медвежьего поглощения может сигнализировать о завершении восходящего тренда и начале нисходящего тренда.
Оба типа поглощения указывают на смену настроений на рынке и возможное изменение направления движения цены. Однако, как и другие свечные паттерны, поглощение требует подтверждения последующими свечами или дополнительными инструментами, чтобы сигнал о развороте был надежным.
Харами
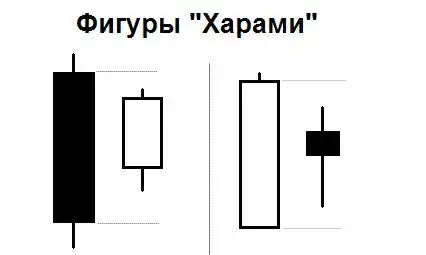
Название "харами" происходит от японского слова, означающего "беременная".
Паттерн харами может быть как бычьим, так и медвежьим. Бычий харами появляется после нисходящего тренда и сигнализирует о возможном развороте вверх. Он состоит из большой медвежьей свечи, за которой следует маленькая бычья свеча. Тело маленькой свечи полностью находится внутри тела предыдущей большой свечи. Это указывает на ослабление давления со стороны продавцов и возможность перехода контроля к покупателям.
Медвежий “харами”, напротив, возникает после восходящего тренда и указывает на возможный разворот вниз. Он состоит из большой бычьей свечи, за которой следует маленькая медвежья свеча. Тело маленькой свечи также полностью находится внутри тела предыдущей большой свечи. Этот паттерн указывает на ослабление давления со стороны покупателей и возможность перехода контроля к продавцам.
Паттерн “харами” часто указывает на нерешительность рынка и потенциальную смену направления тренда.
Тройные свечные модели
Утренняя и вечерняя звезда
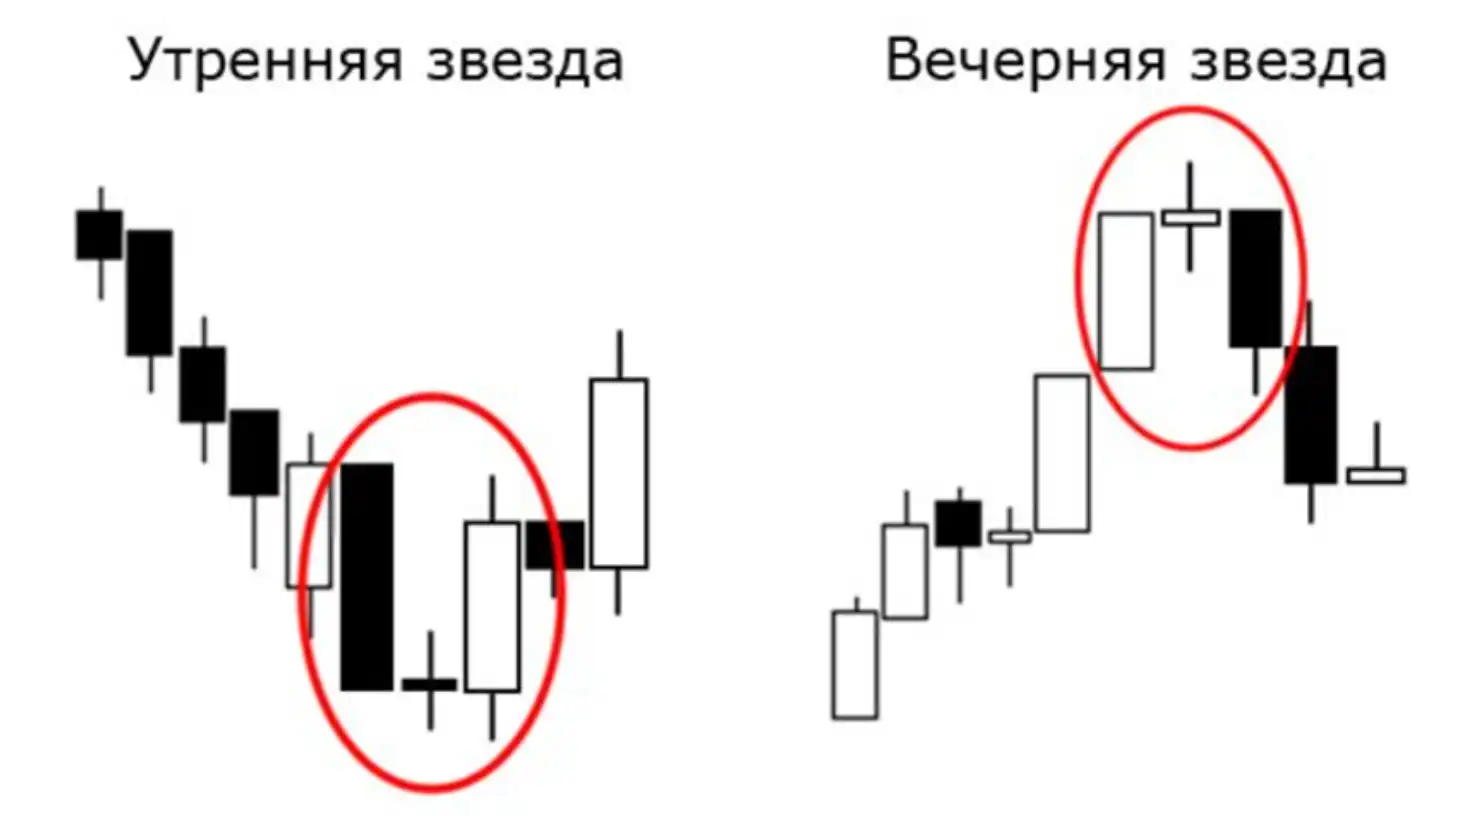
"Утренняя звезда" – еще один разворотный паттерн. Этот паттерн состоит из трех свечей и представляет собой сочетание бычьих и медвежьих сигналов, которые указывают на ослабление предыдущего нисходящего тренда и потенциальный разворот.
Паттерн "Утренняя звезда" включает следующие три свечи:
- Первая свеча: длинная медвежья свеча, которая подтверждает существующий нисходящий тренд. Эта свеча показывает сильное давление продавцов и продолжение падения цены.
- Вторая свеча: небольшая свеча (как правило, доджи), которая может быть бычьей или медвежьей, но главное, чтобы она закрывалась ниже первой свечи. Эта свеча указывает на нерешительность рынка, поскольку цена колеблется в узком диапазоне. Важно, чтобы тело второй свечи было небольшим, что свидетельствует о равновесии между продавцами и покупателями.
- Третья свеча: длинная бычья свеча, которая закрывается внутри тела первой медвежьей свечи. Эта свеча подтверждает начало восходящего тренда и показывает, что покупатели взяли контроль над рынком, перекрыв предыдущие потери.
Паттерн "Утренняя звезда" указывает на ослабление нисходящего тренда и потенциальный разворот вверх. Появление этой модели свидетельствует о том, что продавцы теряют силу, и покупатели начинают доминировать на рынке.
"Вечерняя звезда" также является разворотным паттерном. Он состоит из трех свечей и представляет собой сочетание бычьих и медвежьих сигналов, указывающих на ослабление текущего восходящего тренда и потенциальный разворот вниз.
Паттерн "Вечерняя звезда" включает следующие три свечи:
- Первая свеча: длинная бычья свеча, которая подтверждает существующий восходящий тренд. Эта свеча показывает сильное давление покупателей и продолжение роста цены.
- Вторая свеча: небольшая свеча (как правило, доджи), которая может быть бычьей или медвежьей, но главное, чтобы она закрывалась выше первой свечи.
- Третья свеча: длинная медвежья свеча, которая закрывается внутри тела первой бычьей свечи. Эта свеча подтверждает начало нисходящего тренда и показывает, что продавцы взяли контроль над рынком, перекрыв предыдущие достижения.
Паттерн "Вечерняя звезда" указывает на ослабление восходящего тренда и потенциальный разворот вниз. Появление этой модели свидетельствует о том, что покупатели теряют силу, и продавцы начинают доминировать на рынке.
Три белых солдата и три черных вороны
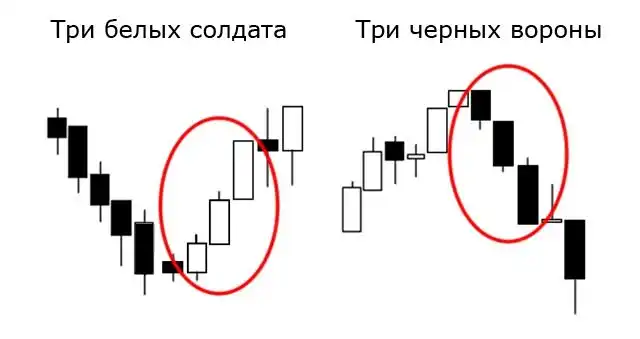
Паттерн “три белых солдата” возникает после продолжительного нисходящего тренда и небольшой фазы консолидации. Трейдеры рассматривают его как один из наиболее явных сигналов окончания медвежьего рынка.
“Три белых солдата” включают в себя следующие свечи:
- Зеленую свечу, появляющуюся после нисходящего движения.
- Вторую зеленую свечу с телом, больше чем у первой, и почти отсутствующим верхним фитилем.
- Третью зеленую свечу с телом, которое как минимум равно телу второй свечи, и практически без фитиля.
Паттерн “Три черных ворона” является противоположностью паттерна “Три белых солдата”. Он появляется после восходящего тренда и состоит из трех последовательных длинных красных свечей, что трактуется как сильный сигнал окончания бычьего рынка.
Вторая свеча должна иметь короткий или отсутствующий нижний фитиль, а третья практически не иметь фитиля.
.webp)
Торговые стратегии на основе свечных моделей
Торговые стратегии на основе свечных моделей являются популярным инструментом для трейдеров на финансовых рынках. Эти стратегии основаны на анализе графиков ценовой активности и использовании различных свечных моделей для прогнозирования будущих движений цены. Вот несколько популярных торговых стратегий на основе свечных моделей:
Торговля на основе модели "Перевернутая свечная модель": эта стратегия основана на поиске перевернутых свечных моделей, таких как Молот, Повешенный, Падающая звезда и другие. Когда такая модель появляется на графике, трейдеры могут принимать решения о входе в позицию в направлении, указанном свечной моделью.
Торговля на основе модели "Продолжительная свечная модель": эта стратегия основана на поиске продолжительных свечных моделей, таких как Марубозу и Длинные ноги. Когда такая модель появляется на графике, трейдеры могут принимать решения о входе в позицию и удержании ее в направлении, указанном свечной моделью.
Торговля на основе модели "Свечной паттерн": эта стратегия основана на поиске определенных свечных паттернов, таких как Внутренний бар, Матрешка, Тройное закрытие и другие. Когда такой паттерн появляется на графике, трейдеры могут принимать решения о входе в позицию в соответствии с правилами свечного паттерна.
Торговля на основе модели "Свечной откат": эта стратегия основана на поиске свечных моделей, указывающих на откат цены от предыдущего тренда. Например, свечная модель "Двойная вершина" или "Двойное дно" может указывать на возможный откат цены, и трейдеры могут принимать решения о входе в позицию в соответствии с этим откатом.
Это лишь несколько примеров торговых стратегий на основе свечных моделей. Важно помнить, что эти стратегии должны быть использованы в сочетании с другими инструментами и анализом рынка для принятия более информированных решений.
Trend Following
Trend Following (следование тренду): эта стратегия основана на поиске и торговле в направлении установленного тренда на рынке. Когда тренд явно виден на графике ценовой активности, трейдеры стремятся войти в позицию, следуя направлению тренда. Например, если на графике виден устойчивый восходящий тренд, трейдеры могут искать возможности для входа в долгую позицию и удержания ее до окончания тренда или появления сигналов разворота. Главная идея этой стратегии - поймать длинные движения цены в направлении тренда.
Стратегия торговли Counter Trend
Стратегия торговли Counter Trend (противотрендовая стратегия): эта стратегия основана на идее поиска возможных разворотных точек в направлении, противоположном текущему тренду. Когда цена достигает экстремальных уровней и показывает сигналы о слабости текущего тренда, трейдеры могут рассматривать возможность входа в позицию, ожидая разворота цены. Например, если на графике цена достигает сильного уровня поддержки или сопротивления и показывает сигналы отскока, трейдеры могут рассматривать возможность входа в позицию в направлении, противоположном текущему тренду.
.webp)
Если вы хотите узнать больше о криптовалютах и получить навыки, опыт и инструменты, которые можно сразу применить на криптовалютном рынке, запишитесь на курсы трейдинга в школу трейдинга CRYPTOLOGY.
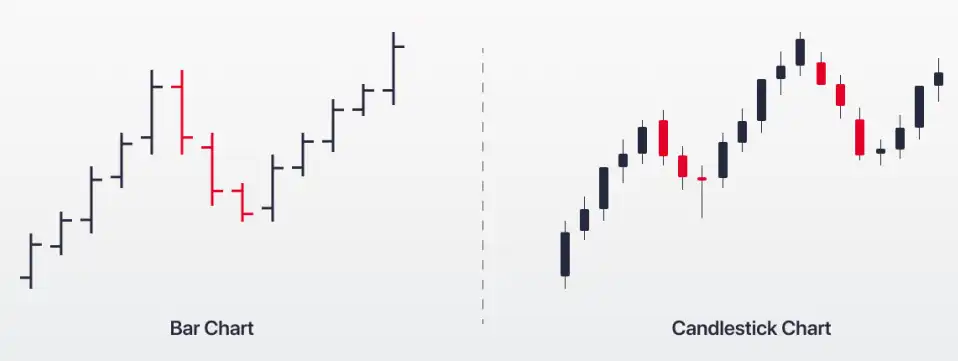
Японские свечи VS бары
И японские свечи, и бары дают трейдерам одинаковую информацию, но в разных графических форматах. Свечной график и график баров оба предоставляют важную информацию о движении цен, но каждый имеет свои особенности.
Свечной график отображает цену открытия, закрытия, максимума и минимума за период с помощью визуально понятных свечей. Цвет и форма свечей дают трейдерам мгновенное представление о настроениях на рынке: бычьи или медвежьи. Свечи также позволяют легко идентифицировать паттерны, указывающие на развороты или продолжение трендов. Считается, что свечи более наглядны и предоставляют более ясную визуализацию ценового движения. Кроме того, они также графически отображают силы спроса и предложения, которые влияют на цену в каждом временном периоде.
График баров также показывает цену открытия, закрытия, максимума и минимума, но в более сжатом формате. Бары менее наглядны, поскольку требуют более внимательного изучения для интерпретации рыночных настроений и поиска паттернов. Бары не предоставляют столько визуальных подсказок о настроениях на рынке, в то время, как цвета и размеры свечей на графике сразу дают представление о динамике рынка, тогда как бары требуют более сложного анализа для той же информации.
В конечном итоге, свечи предоставляют больше информации и являются более визуально интуитивными, однако, конечно, выбор между свечным графиком и графиком баров зависит от предпочтений трейдера и его стиля анализа.
Использование японских свечей в торговле: мнение команды CRYPTOLOGY KEY
Выбирать японские свечи для анализа графика, бары или линейный график – решение каждого. Однако, не просто так же свечные графики получили свою популярность. С первого взгляда на график, благодаря свечам, трейдер уже определяет рыночное настроение. Тела и тени свечей предоставляют трейдерам контекст для понимания рыночных настроений и динамики цен.
Японские свечи – это мощный инструмент анализа ценовой активности на рынке. Они предоставляют трейдерам визуальное представление о движении цен и могут помочь в определении тренда, сигналов разворота и продолжения тренда.
Главное достоинство японских свечей заключается в том, что они универсальны – ими могут пользоваться как профессионалы, так и новички. В начале пути трейдеру очень важно разобраться с достаточно простым строением свечи для того, чтобы понимать азы анализа ценового движения. Конечно, со временем и получением большего опыта, трейдерам намного проще интерпретировать график свечей, поскольку появляется насмотренность.
Тем не менее, важно помнить, что для анализа свечного графика не обязательно помнить все свечные паттерны наизусть для того, чтобы анализ был эффективным, и его уж точно следует обязательно использовать в совокупности с другими методами анализа чарта. Свечной график, безусловно, дает трейдерам огромное количество информации, однако, открывать позиции только на основе паттерна – неразумно.
Важно понимать, что для эффективного использования японских свечей требуется некоторое обучение и практика. Трейдеры должны быть в состоянии читать и интерпретировать различные свечные модели, а также использовать их в сочетании с другими инструментами анализа рынка. Возможность использования свечей вместе с другими инструментами, а не вместо них – их несомненное достоинство, которым может похвастаться не каждый инструмент, и им точно надо пользоваться.
Что такое японские свечи?
Какова история японских свечей?
Какие основные элементы составляют японские свечи?
Какие основные паттерны японских свечей существуют?
Как можно использовать японские свечи в торговле?
Могу ли я научиться анализу японских свечей?

Тогда расскажи друзьям – пусть тоже прокачивают свои навыки. Поделиться можно легко с помощью кнопок внизу или просто скопировав ссылку. Мы будем рады твоим отметкам в соц. сетях!
Поделиться

Подписывайся на нашу email-рассылку и получай свежие аналитические обзоры, новости, инсайты и приглашения на прямые эфиры прямо в свой почтовый ящик. Никакого спама — только ценная информация для трейдеров!
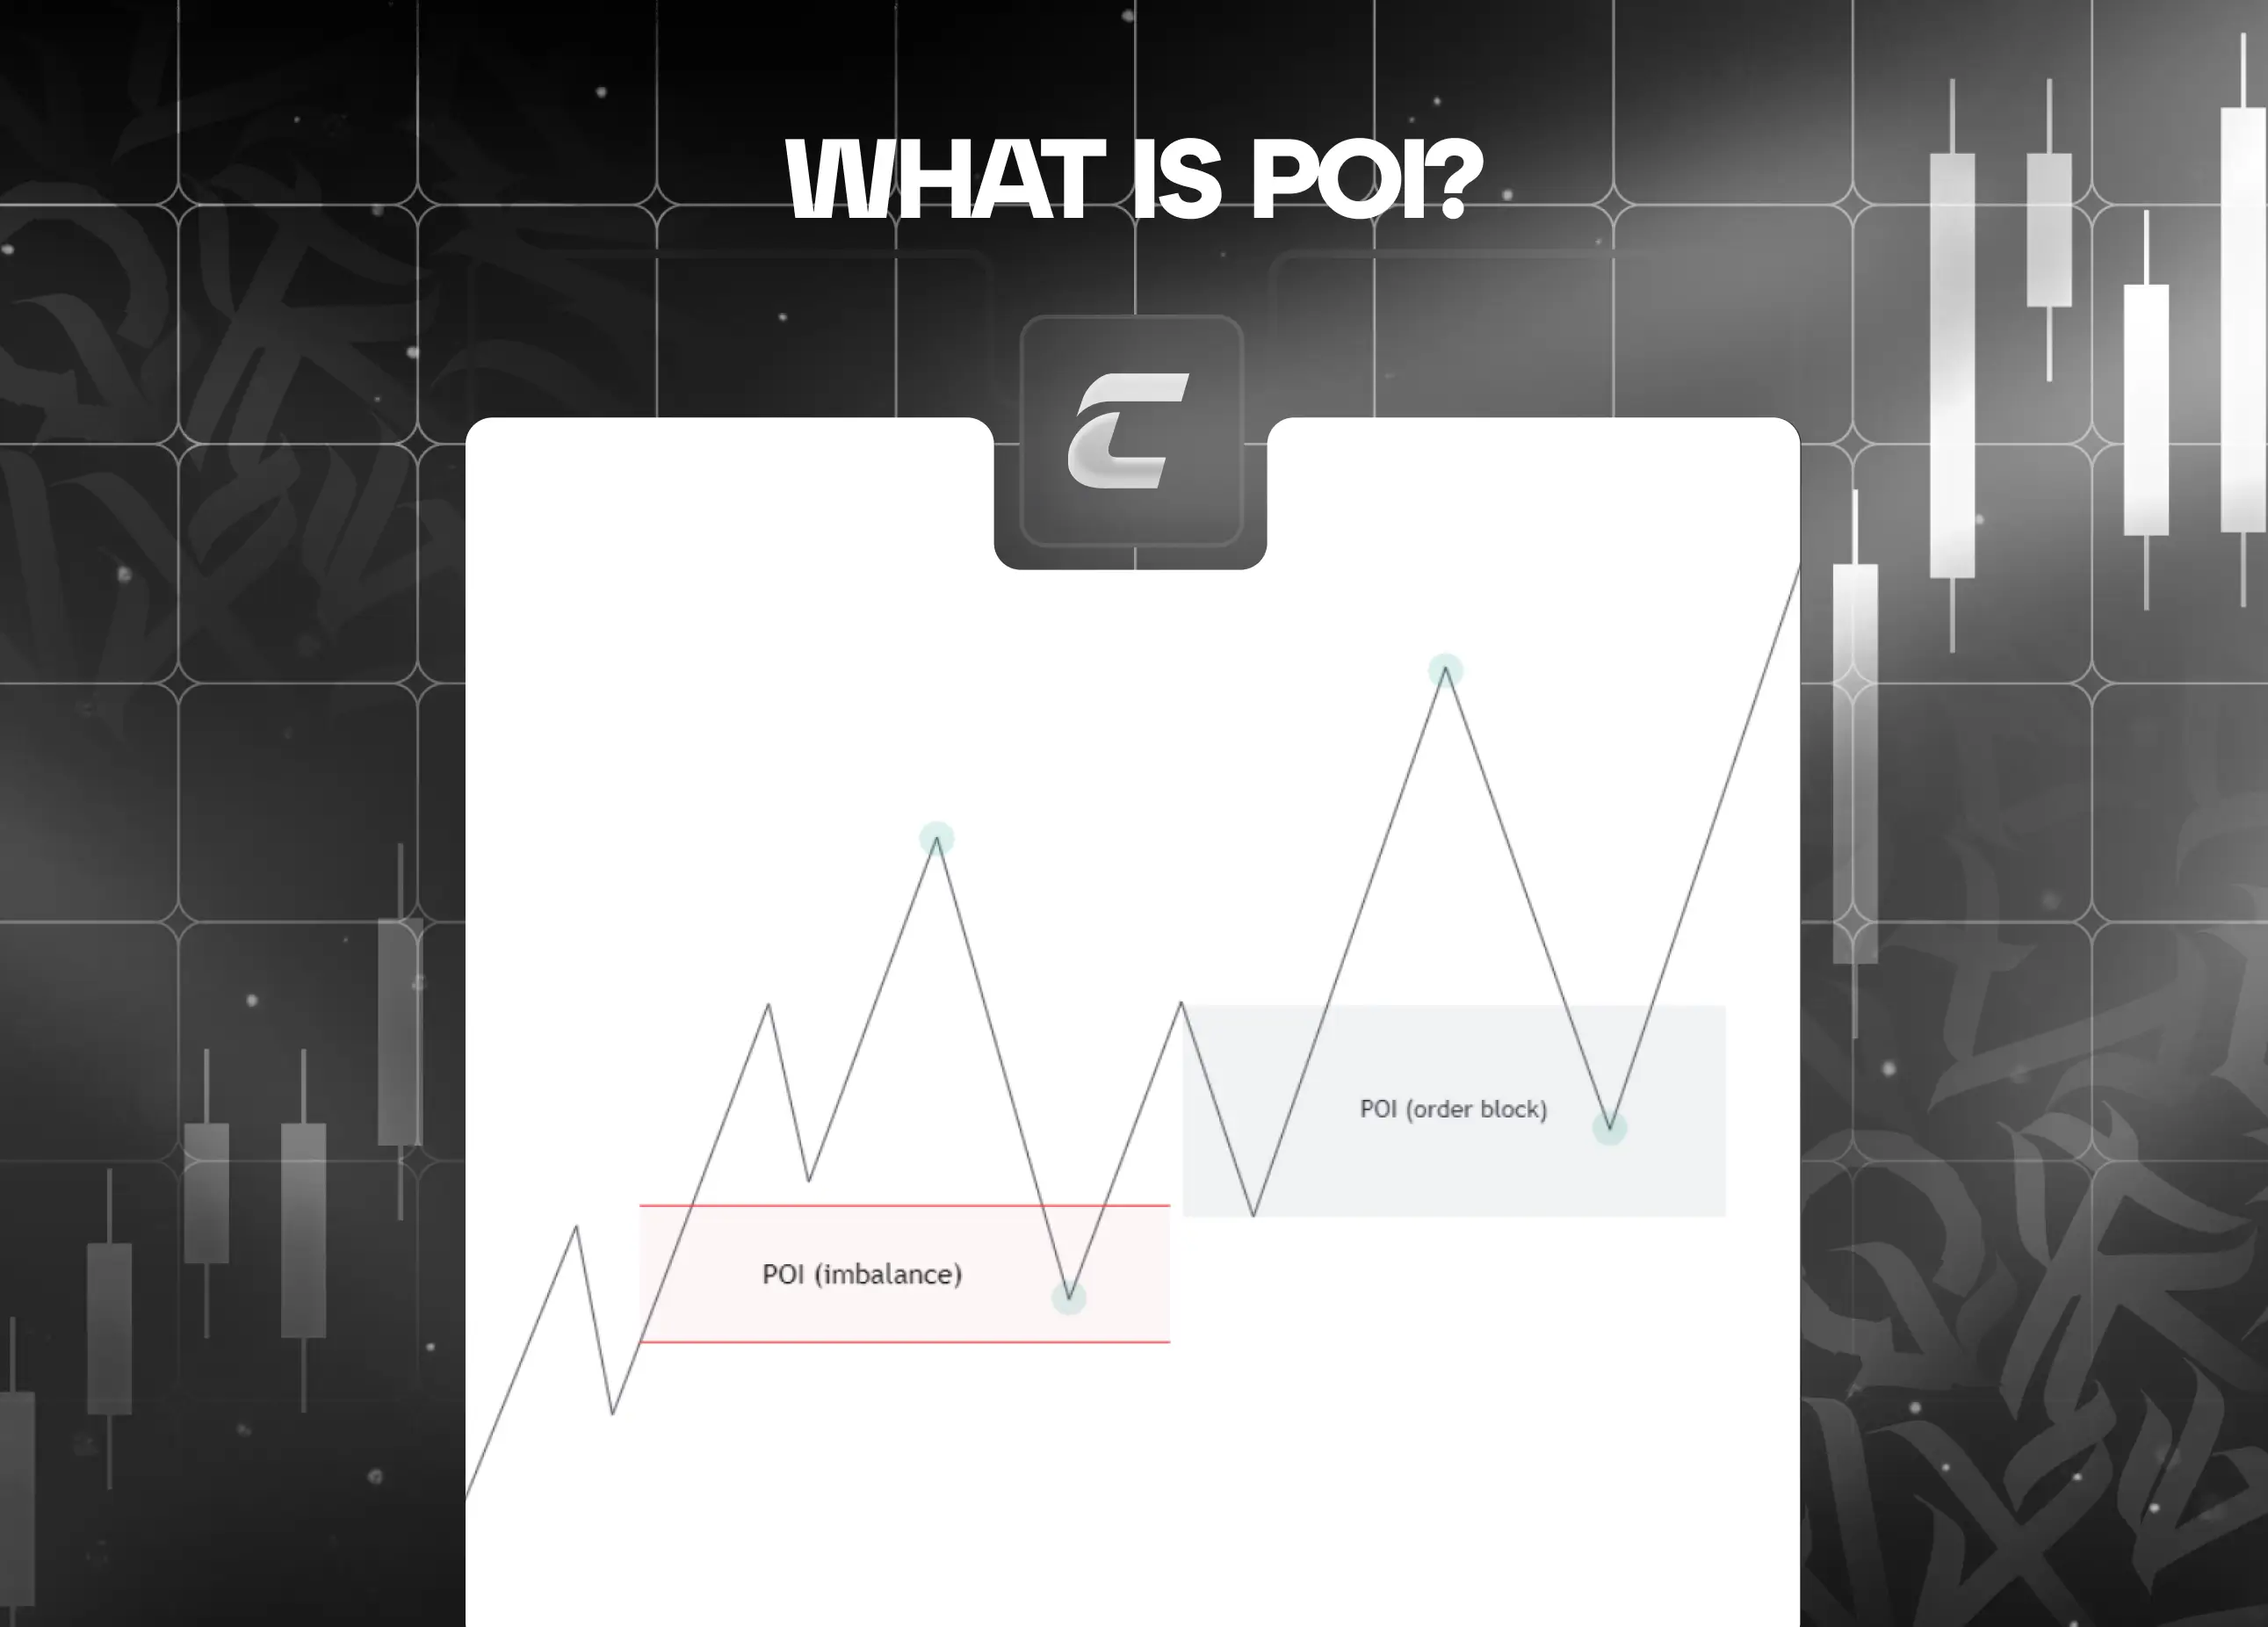
Что такое зона интереса (POI)

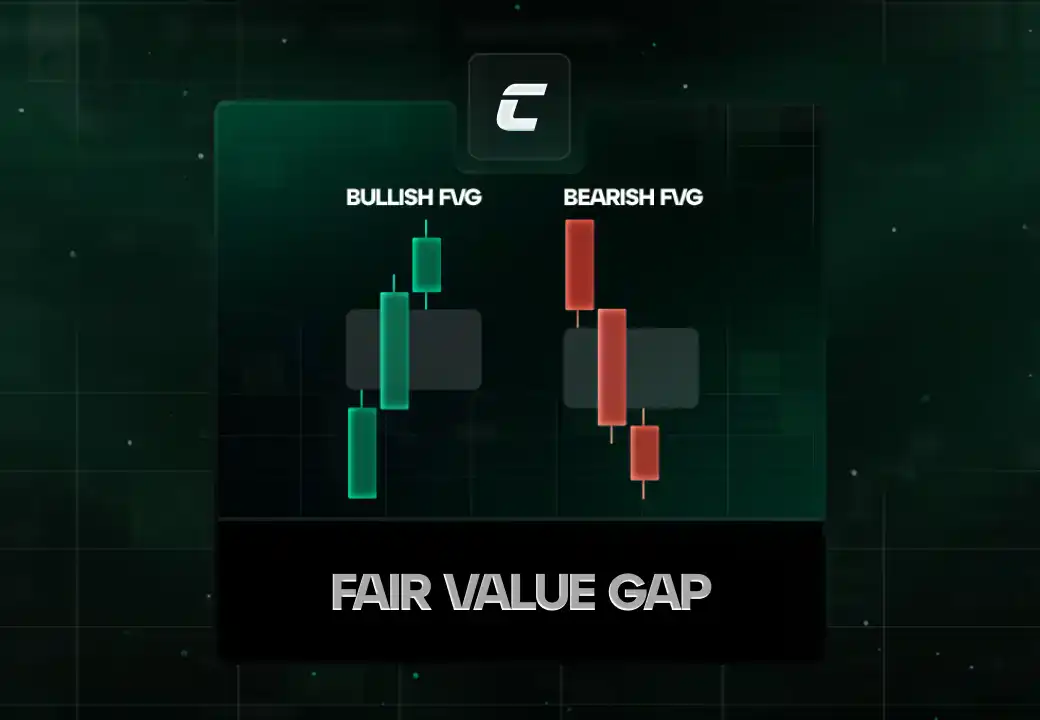
Разновидность: Fair Value Gap (FVG)

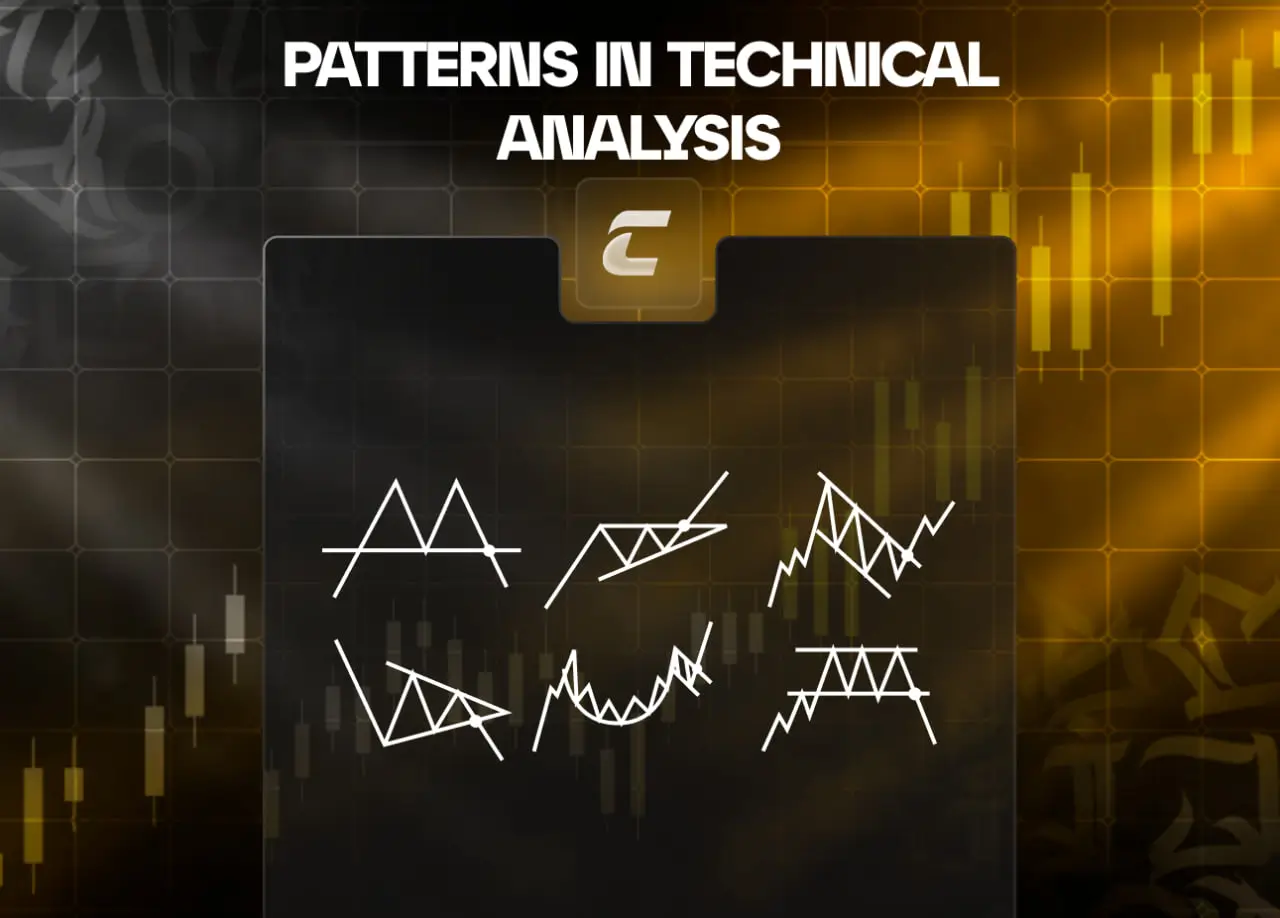
Что такое паттерн в техническом анализе
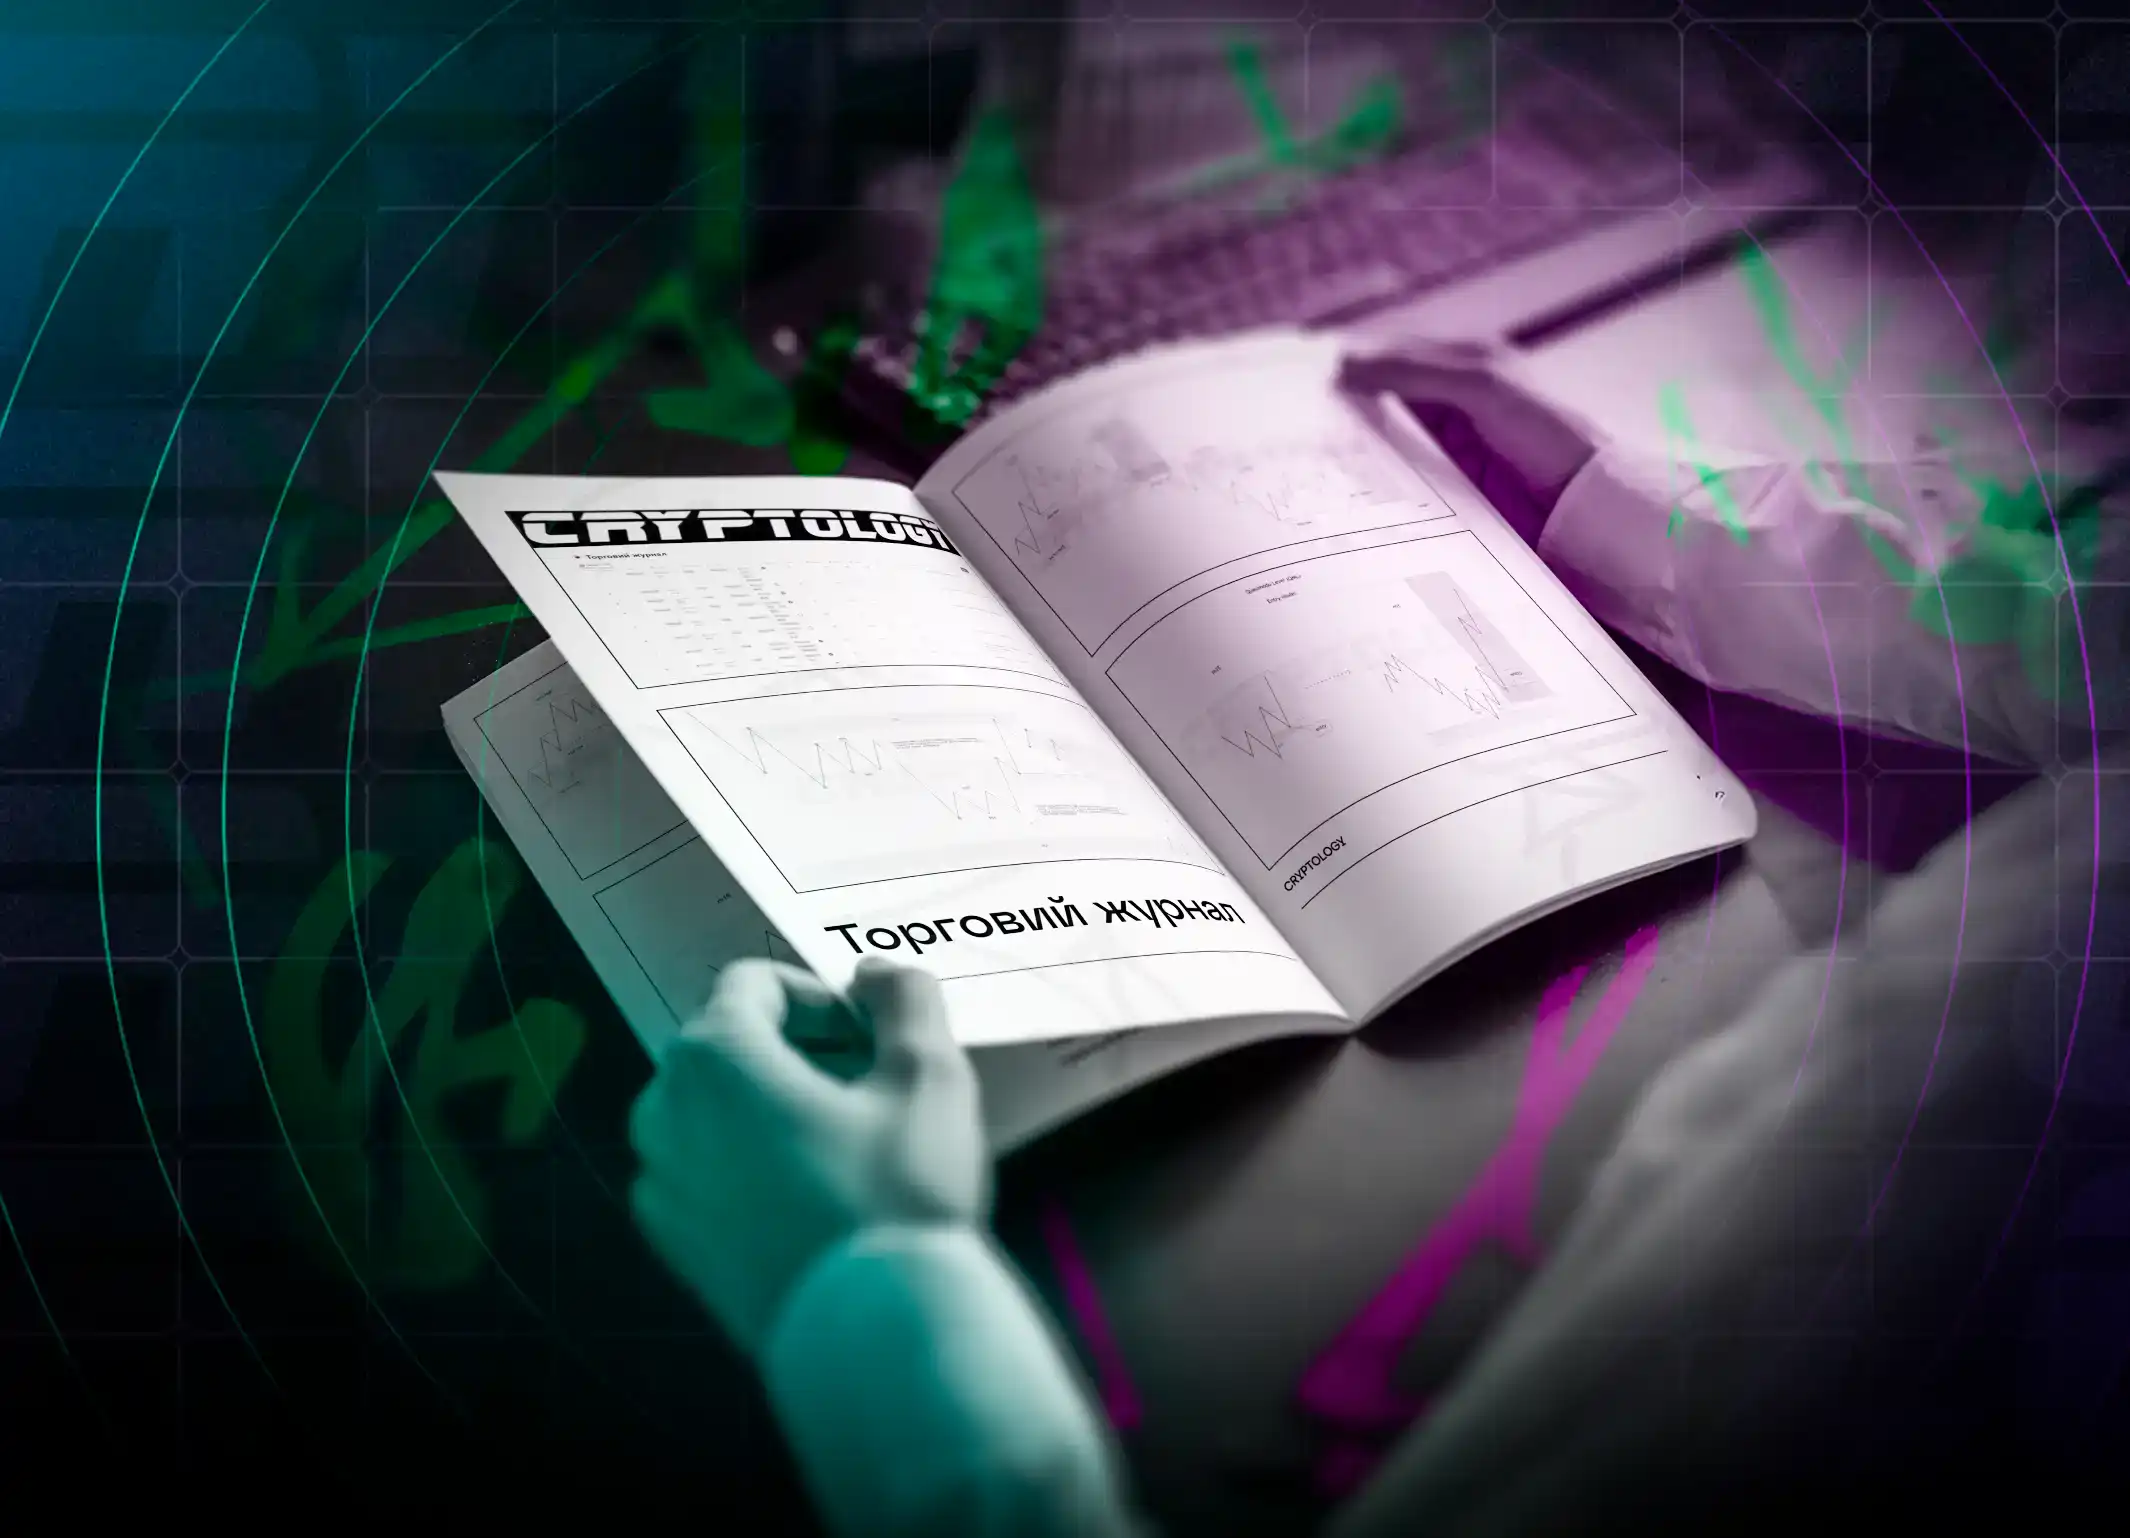
Что такое торговый журнал?

Что такое MACD

Страх. Что это такое и стоит ли избавляться от него? Ч2.

Что такое тикер и зачем он нужен?
Что такое CLS и как его использовать?