Тщательный ресерч – ключ к успеху в инвестировании
Анализ в инвестировании играет критически важную роль, поскольку он помогает инвесторам делать обоснованные решения и минимизировать риски. Когда инвесторы анализируют различные аспекты, они получают ценную информацию, которая может существенно повлиять на успех или неудачу их инвестиций.
Качественный анализ помогает увидеть не только текущее состояние дел, но и потенциальные возможности и угрозы в будущем. Например, анализируя отчеты о доходах компаний и их рыночное положение, инвестор может оценить, насколько устойчиво развивается бизнес и каковы его перспективы в долгосрочной перспективе.
Анализ помогает распознавать и избегать потенциально невыгодных или рискованных инвестиций, предоставляя возможность изучить прошлую динамику и ошибки других инвесторов. Это позволяет формировать более разнообразный и устойчивый инвестиционный портфель.
Таким образом, анализ является неотъемлемой частью процесса инвестирования, предоставляя необходимую информацию для принятия взвешенных решений, управления рисками и достижения долгосрочных инвестиционных целей.
В первой части ресурсов для анализа криптопроектов мы рассмотрели агрегаторы информации, календари и новостные порталы. Сегодня мы продолжим говорить о платформах, которые могут помочь в принятии инвестиционных решений.

CoinGlass
CoinGlass – это платформа, специализирующаяся на анализе данных о рынках деривативов криптовалют. Платформа охватывает данные об объемах торгов фьючерсами на криптовалюты, открытом интересе на различные токены, соотношении лонгов и шортов, ставках финансирования, ликвидациях, ставках финансирования, а также о данных по опционам и многих других инструментах. CoinGlass позволяет пользователям настраивать метрики в соответствии с их нуждами.
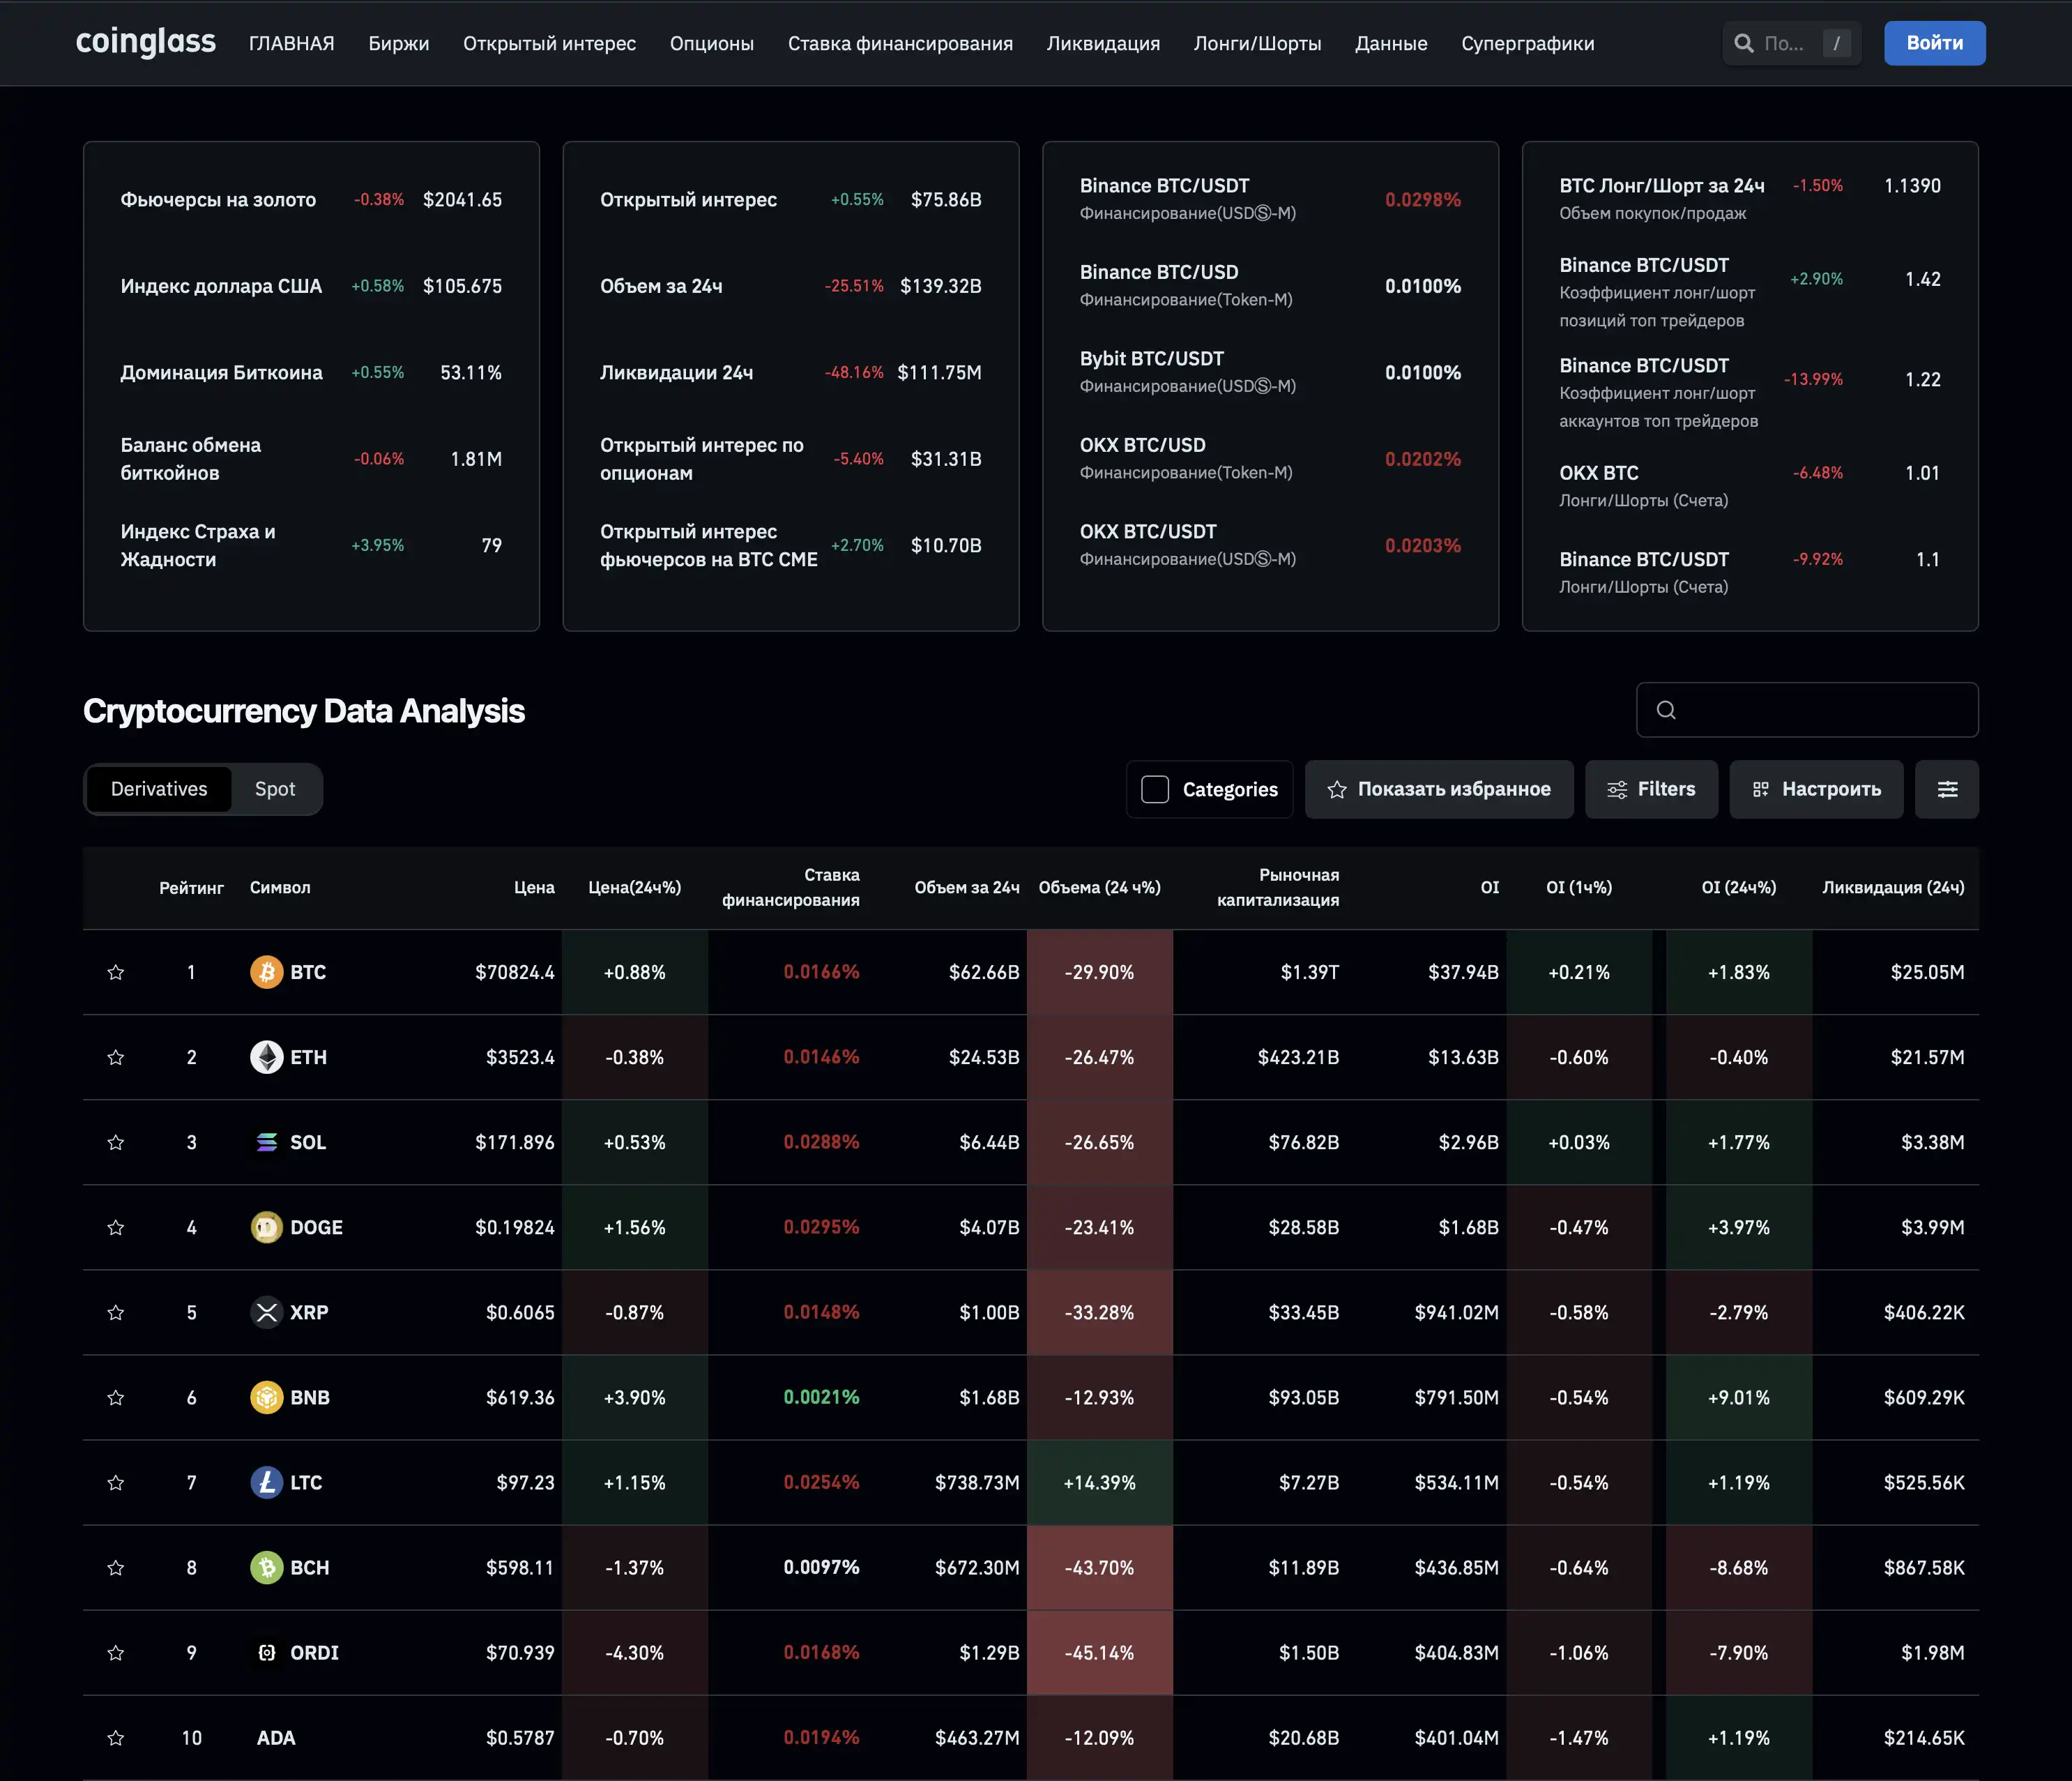
Мониторинг ликвидаций
Раздел "Мониторинг ликвидаций" на платформе Coinglass предоставляет обширные данные о ликвидациях позиций на различных криптовалютных биржах, что помогает пользователям оценить динамику рынка.
Этот инструмент позволяет трейдерам оценить, насколько "перегрет" рынок, и избегать входа в торги в моменты повышенного риска. Также это дает возможность определить моменты, когда рынок может быть перепродан или перекуплен, что может служить сигналом к открытию или закрытию позиций. Понимание того, когда и почему происходят массовые ликвидации, помогает трейдерам улучшить свои стратегии риск-менеджмента и повысить эффективность своей торговли.
Кроме того, не забываем, что чреда ликвидаций – это тот же ордер, только принудительный, а большое количество исполненных ордеров в ту или иную сторону, вызывает цепную реакцию и соответствующие изменения цены актива.
На платформе эта информация представлена в виде графиков и диаграмм, что упрощает поиск, анализ и интерпретацию данных.
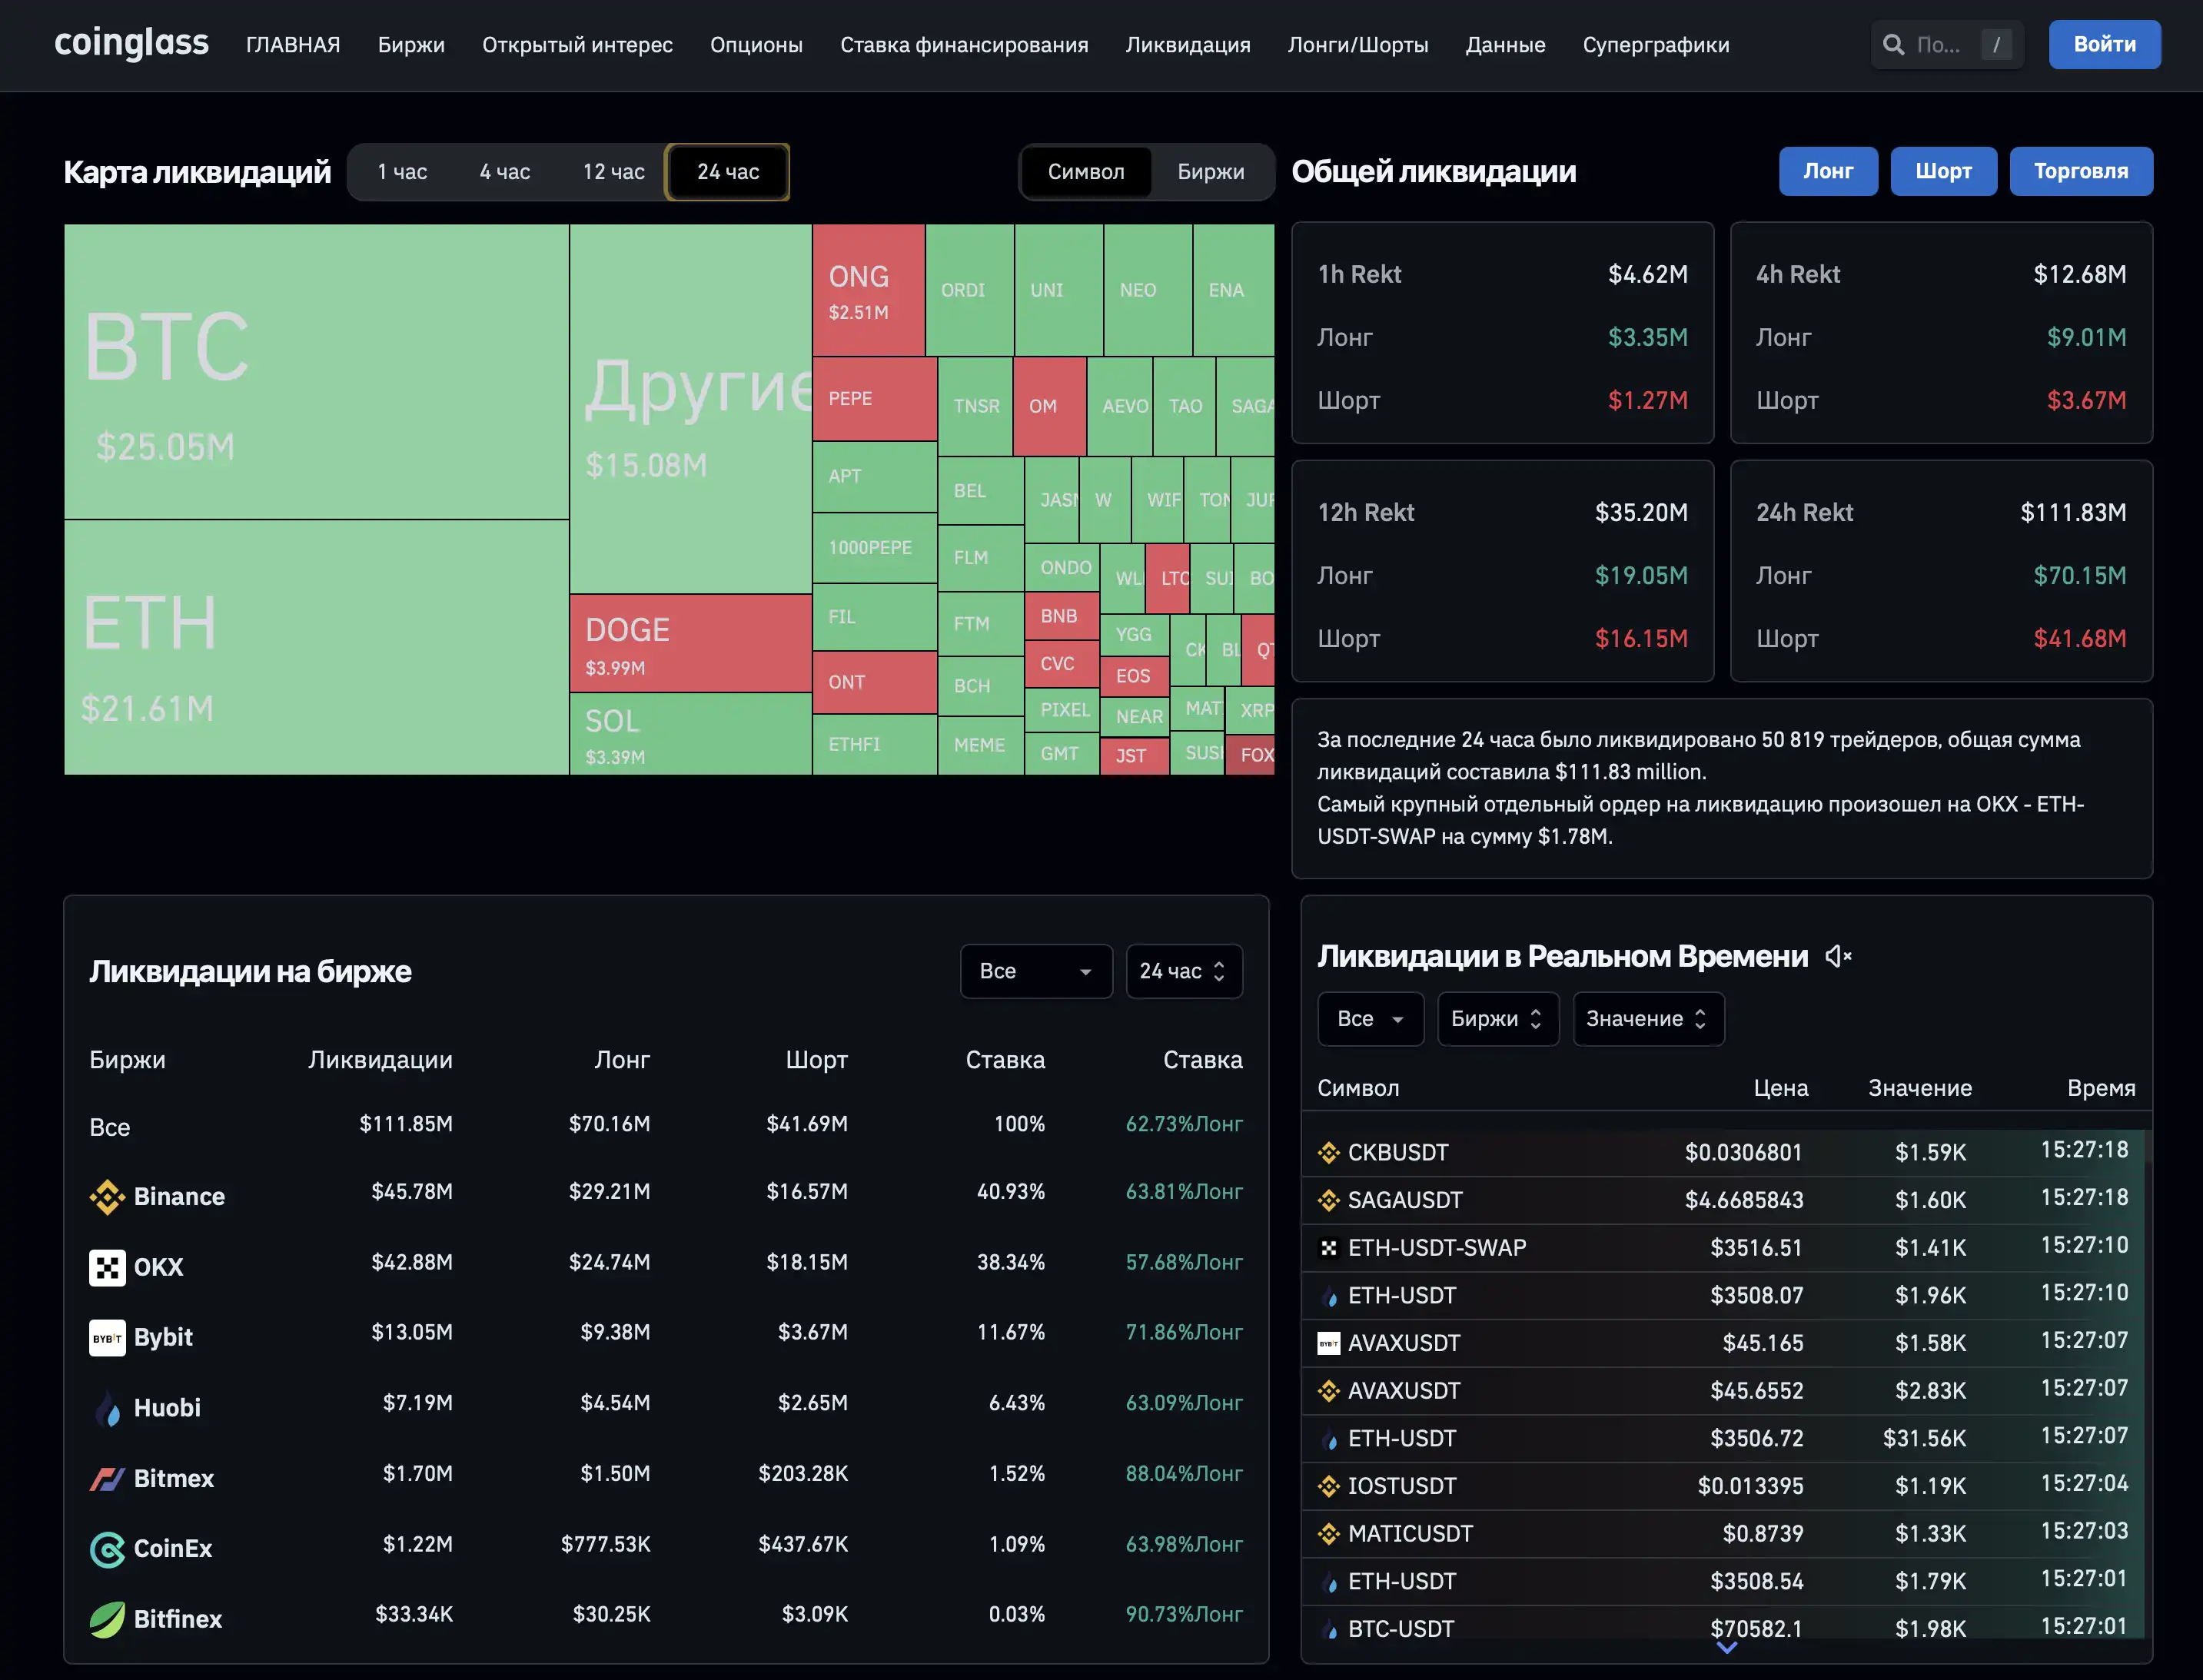
Ставка финансирования
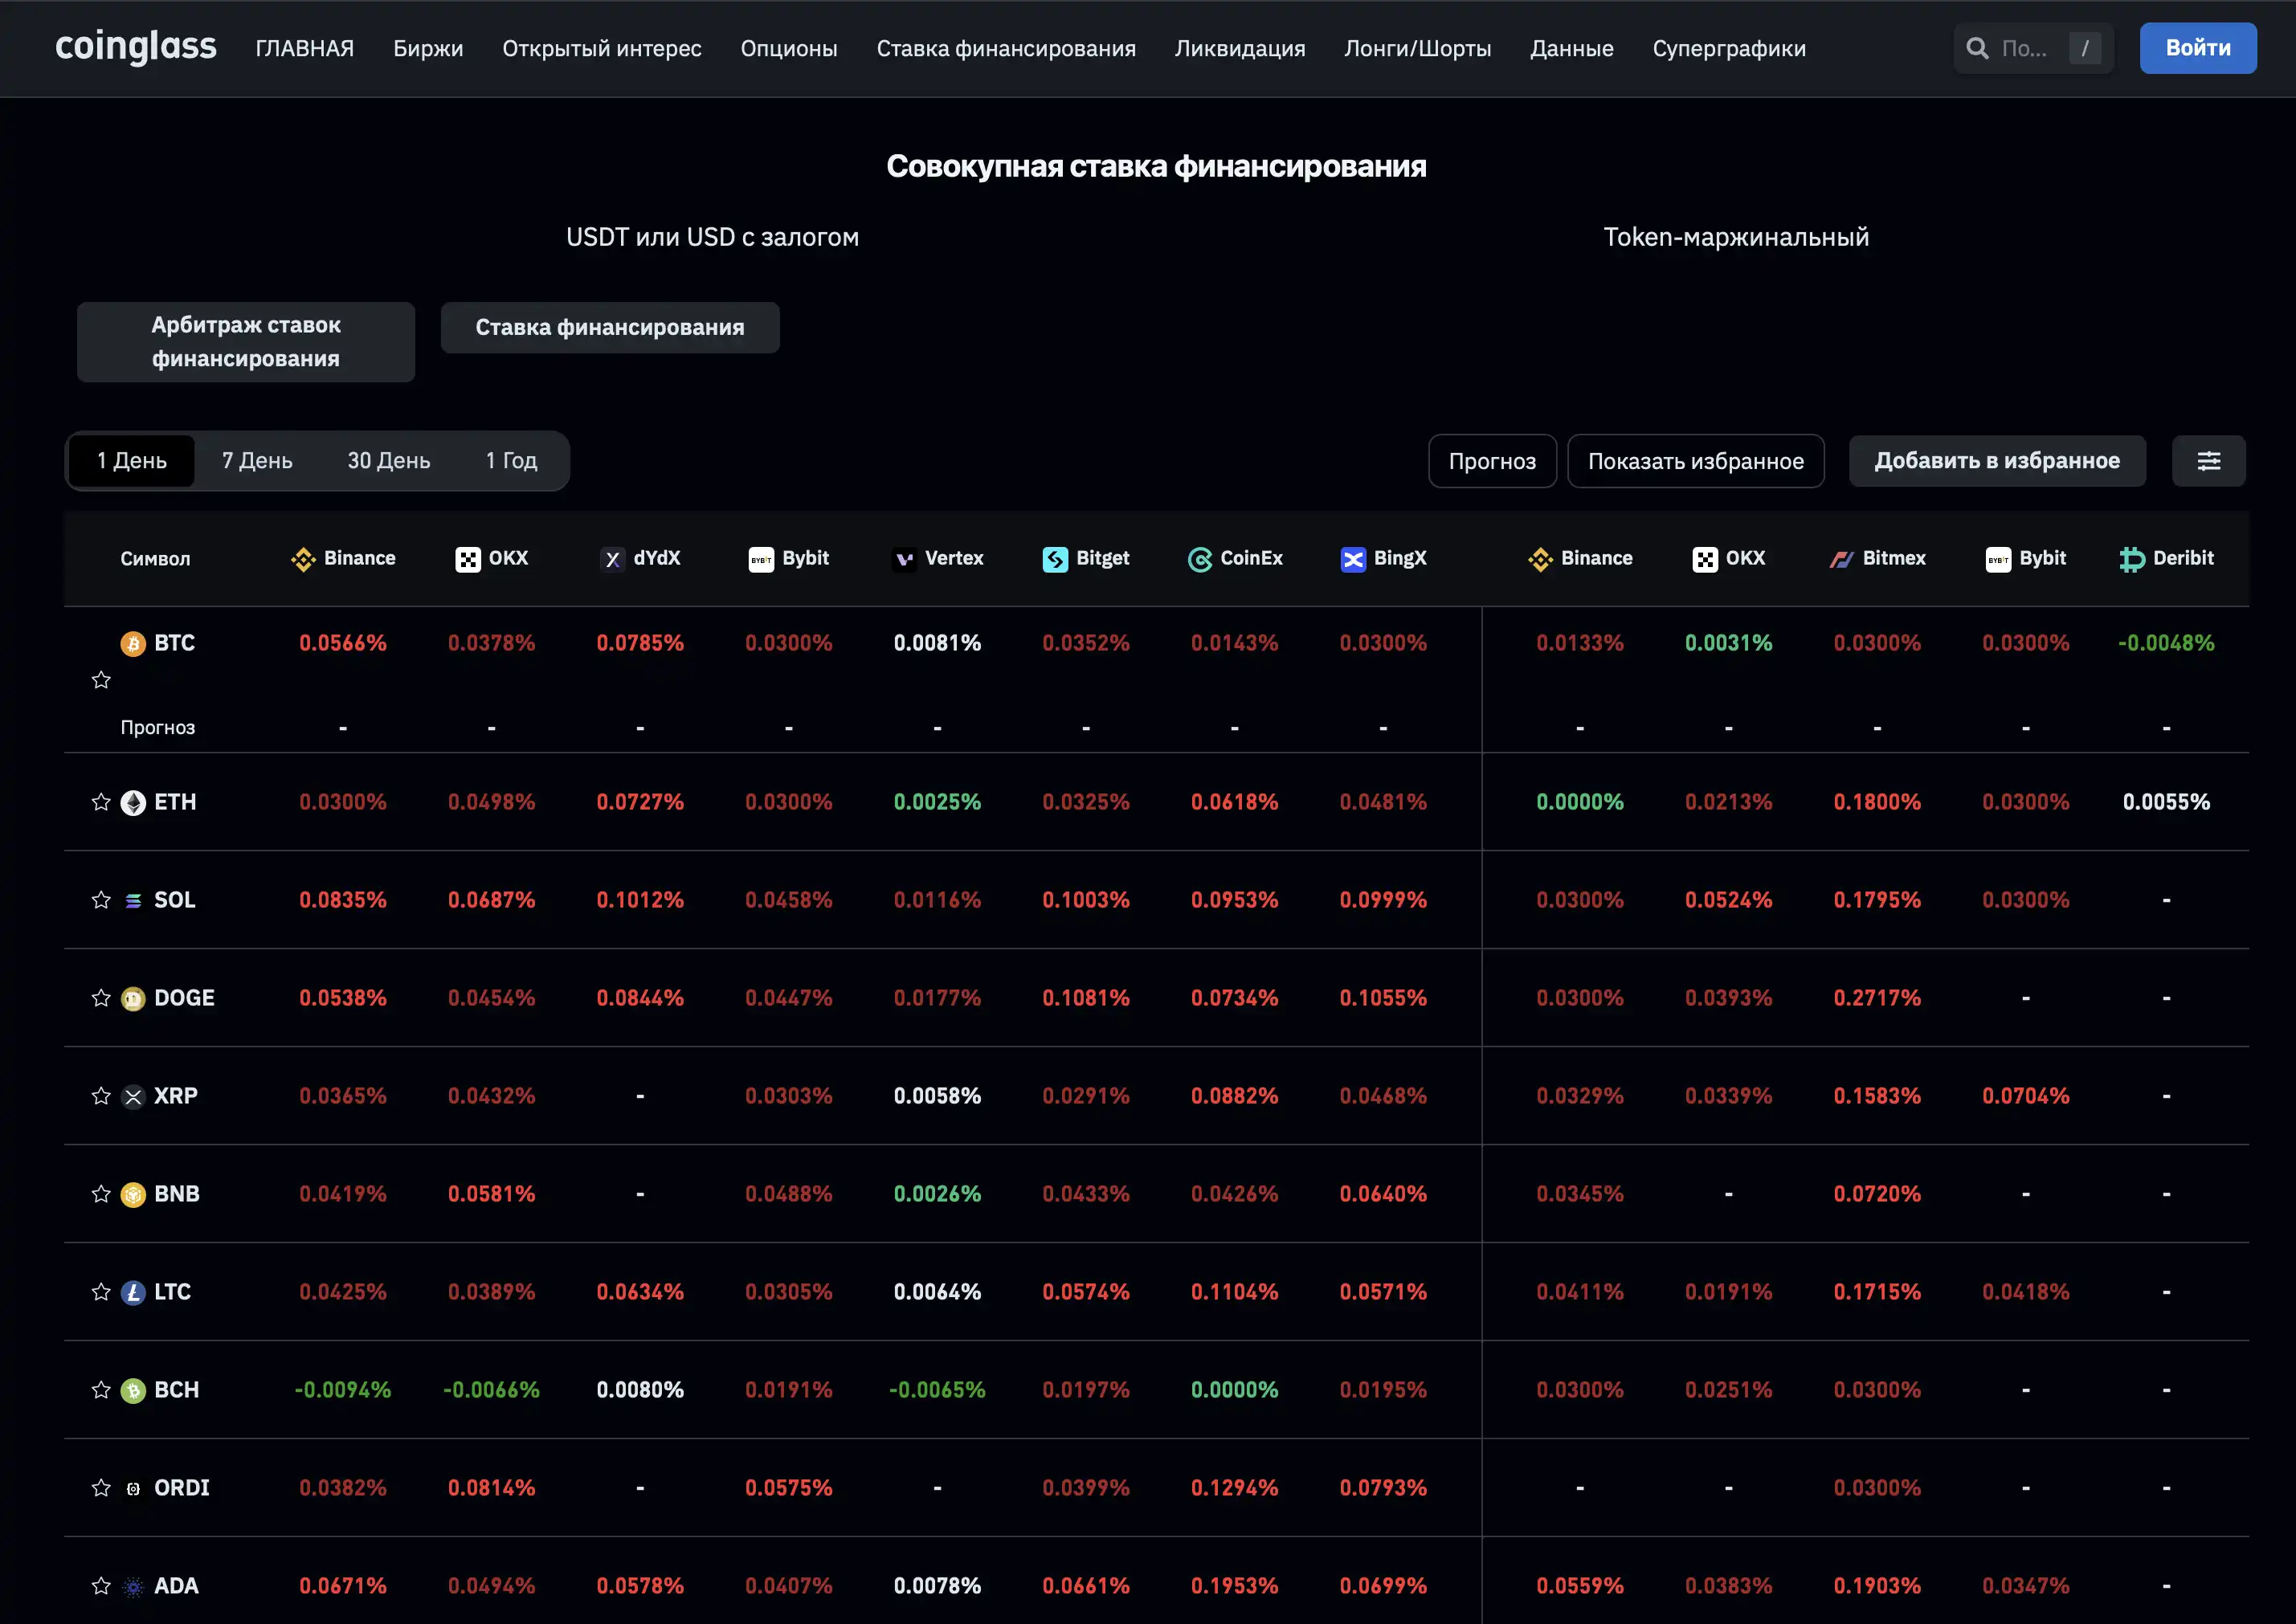
Ставка финансирования – это механизм, используемый на этих рынках для обеспечения того, чтобы цены деривативов оставались близкими к спотовым ценам базового актива. Ставка финансирования является важным индикатором рыночного настроения и баланса между длинными и короткими позициями. Регулярное наблюдение за ставками финансирования может помочь трейдерам:
- Оценить стоимость удержания позиции: высокие ставки финансирования могут сделать удержание длинной позиции дорогостоящим и наоборот;
- Предсказать возможные развороты рынка: сильные изменения в ставках финансирования могут предвещать изменения в рыночном настроении;
- Использовать ставку финансирования, чтобы заработать. Когда ставка положительна, это указывает на то, что цены на активы на спотовом рынке ниже, чем на фьючерсном. Это часто связано с тем, что большинство трейдеров держат длинные позиции (лонги), что создает избыток потенциальных продавцов. В таком случае, когда эти позиции закрываются, происходит продажа, что может оказывать давление на цены активов.
В обратной ситуации, когда ставка отрицательна, это может означать преобладание коротких позиций (шортов) на рынке по сравнению с длинными. Это создает ситуацию, когда на рынке больше потенциальных покупателей, чем продавцов, так как закрытие шортов включает процесс покупки. Такое состояние может способствовать повышению цен на активы. Подробнее писали тут.
Лонги/Шорты
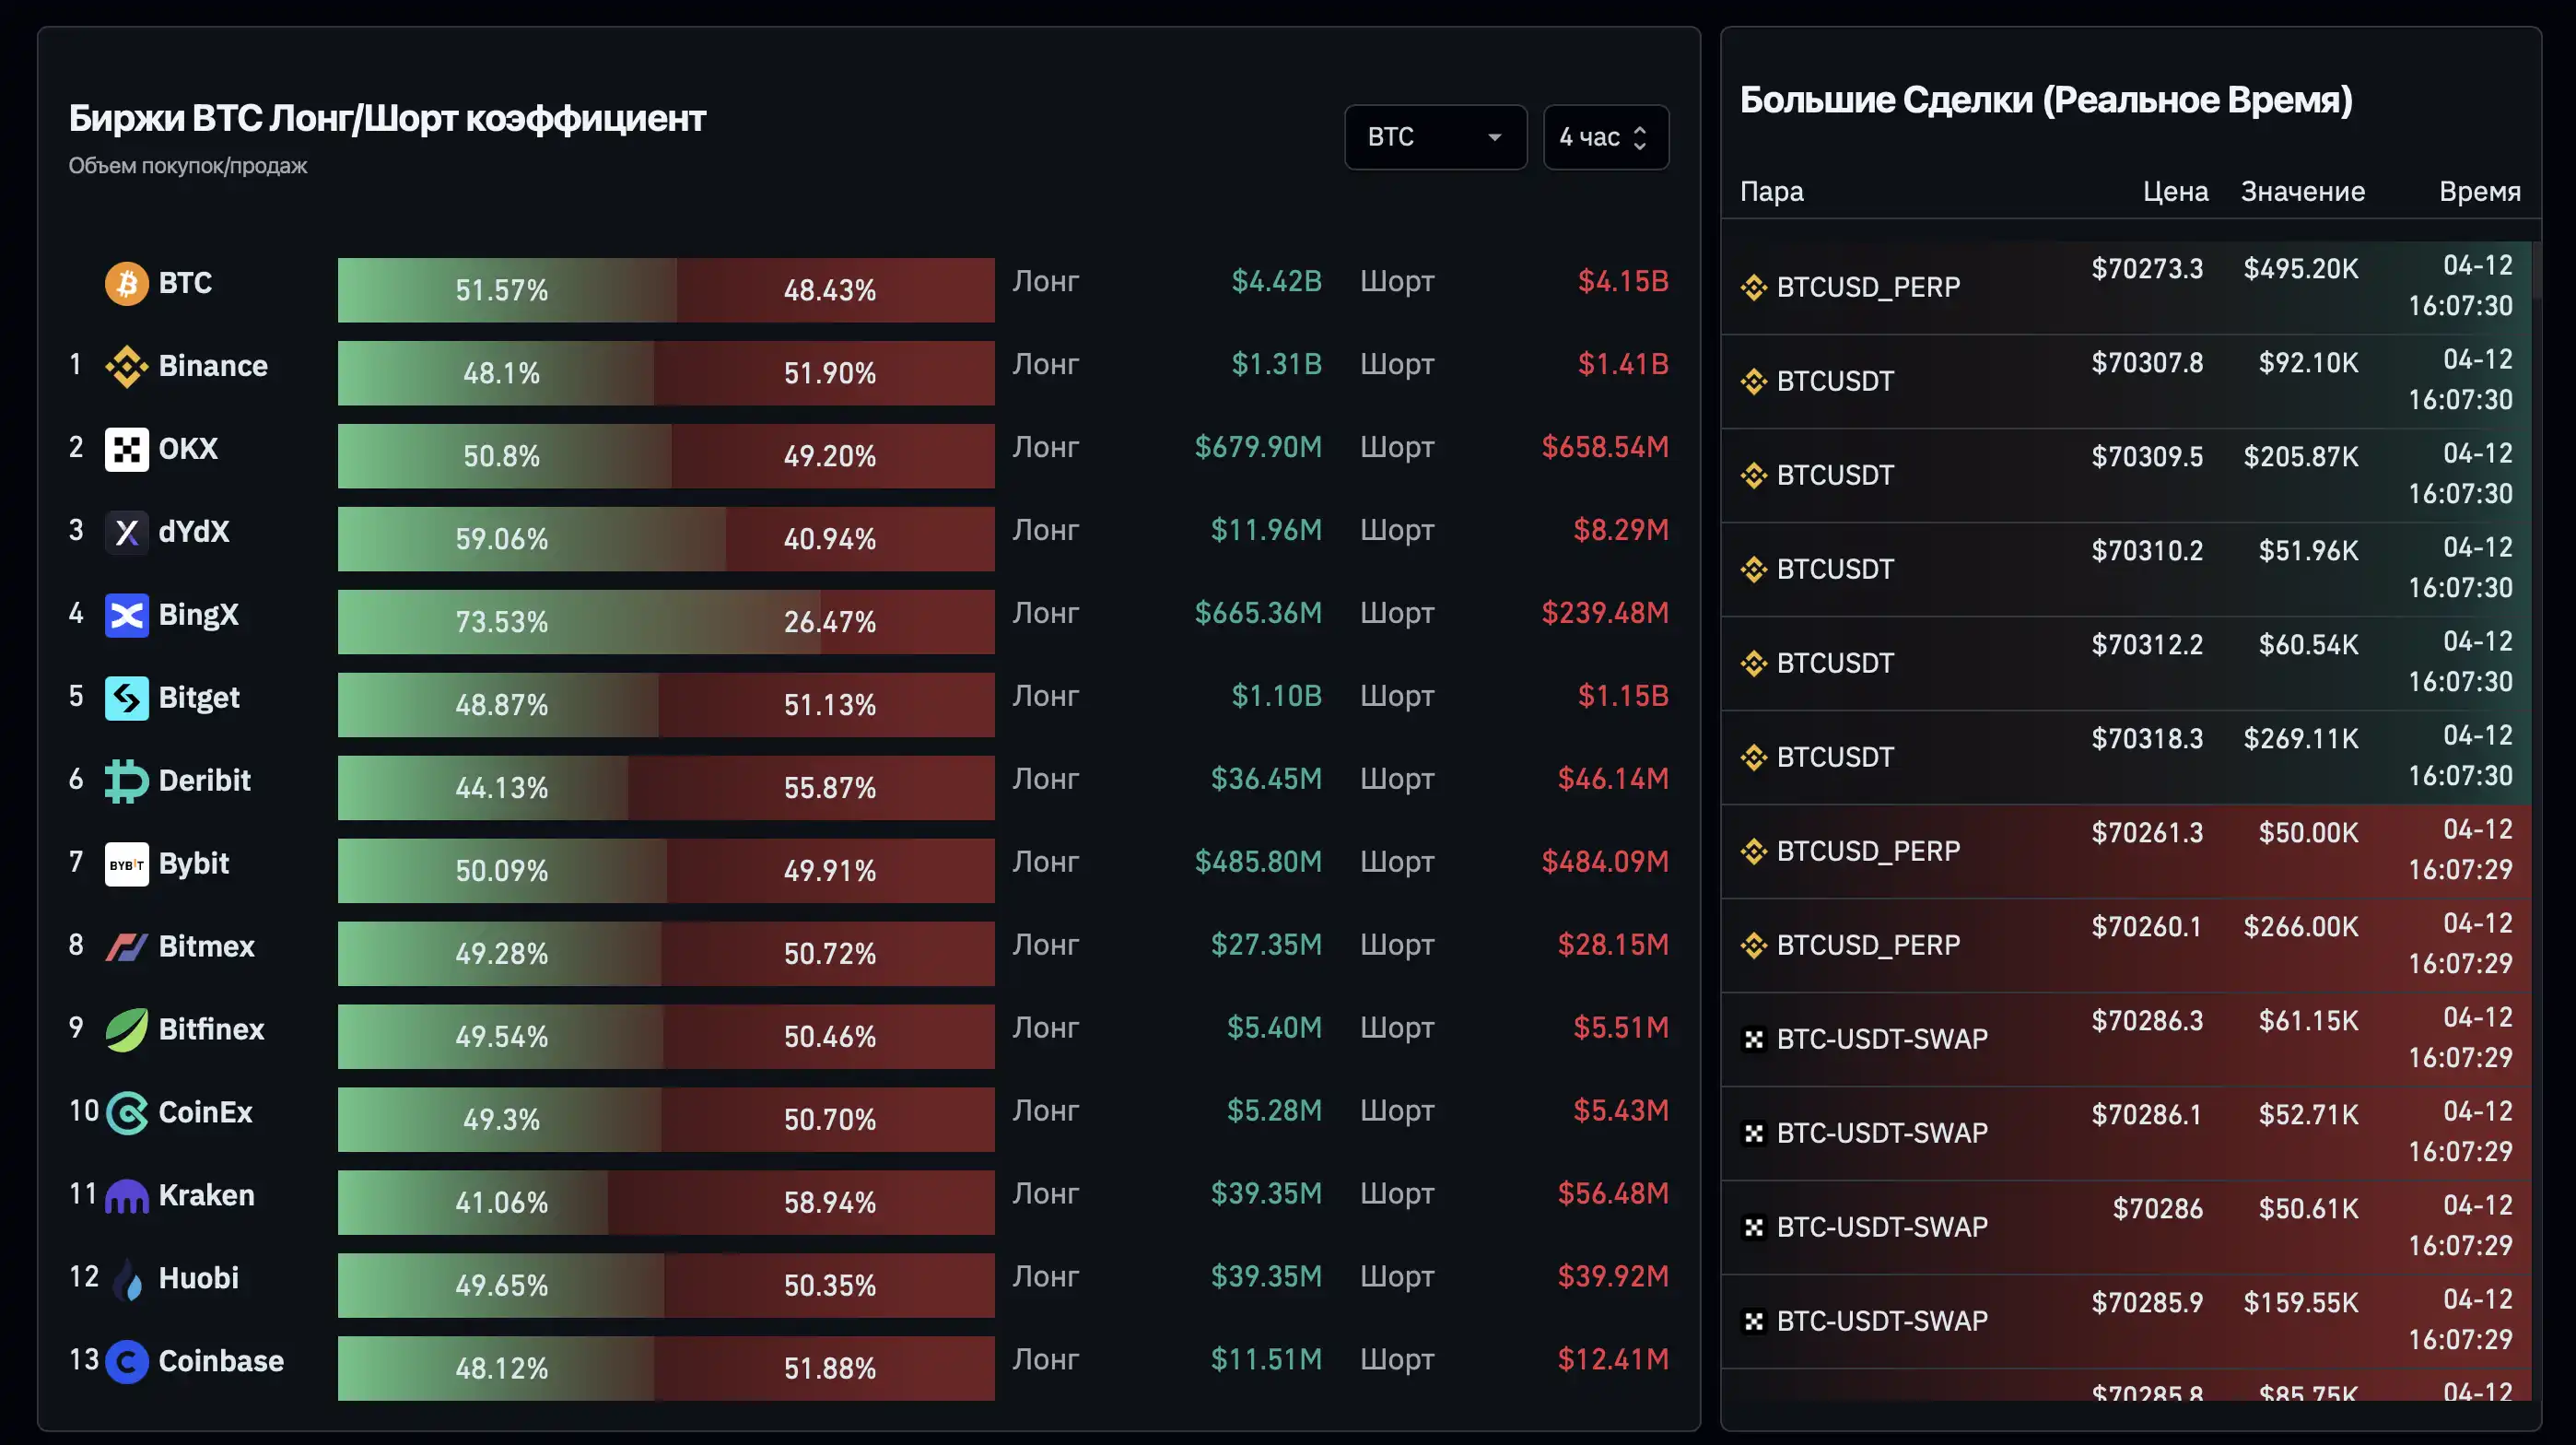
Раздел "Соотношение лонгов и шортов" позволяет трейдерам увидеть текущее распределение длинных (лонгов) и коротких (шортов) позиций на различных криптовалютных биржах и парах. Соотношение лонгов и шортов часто используется как индикатор настроения рынка. Преобладание лонгов может указывать на оптимистичное настроение участников рынка, ожидающих роста цен, в то время как преобладание шортов может свидетельствовать о пессимистичных ожиданиях и возможном падении – хотя, конечно, это не работает во всех 100% случаев.
Кроме этих разделов, Coinglass может похвастаться еще многими интересными и удобными метриками.
Тут, в том числе можно отслеживать те самые долгожданные спотовые BTC ETF от Grayscale и многое другое. В последние годы аналитическая платформа Coinglass выросла в популярности среди трейдеров благодаря своей способности предоставлять критически важные и актуальные данные, которые находятся в высоком спросе у каждого участника криптовалютного рынка.
Уверены, что каждый трейдер найдет для себя что-то полезное.
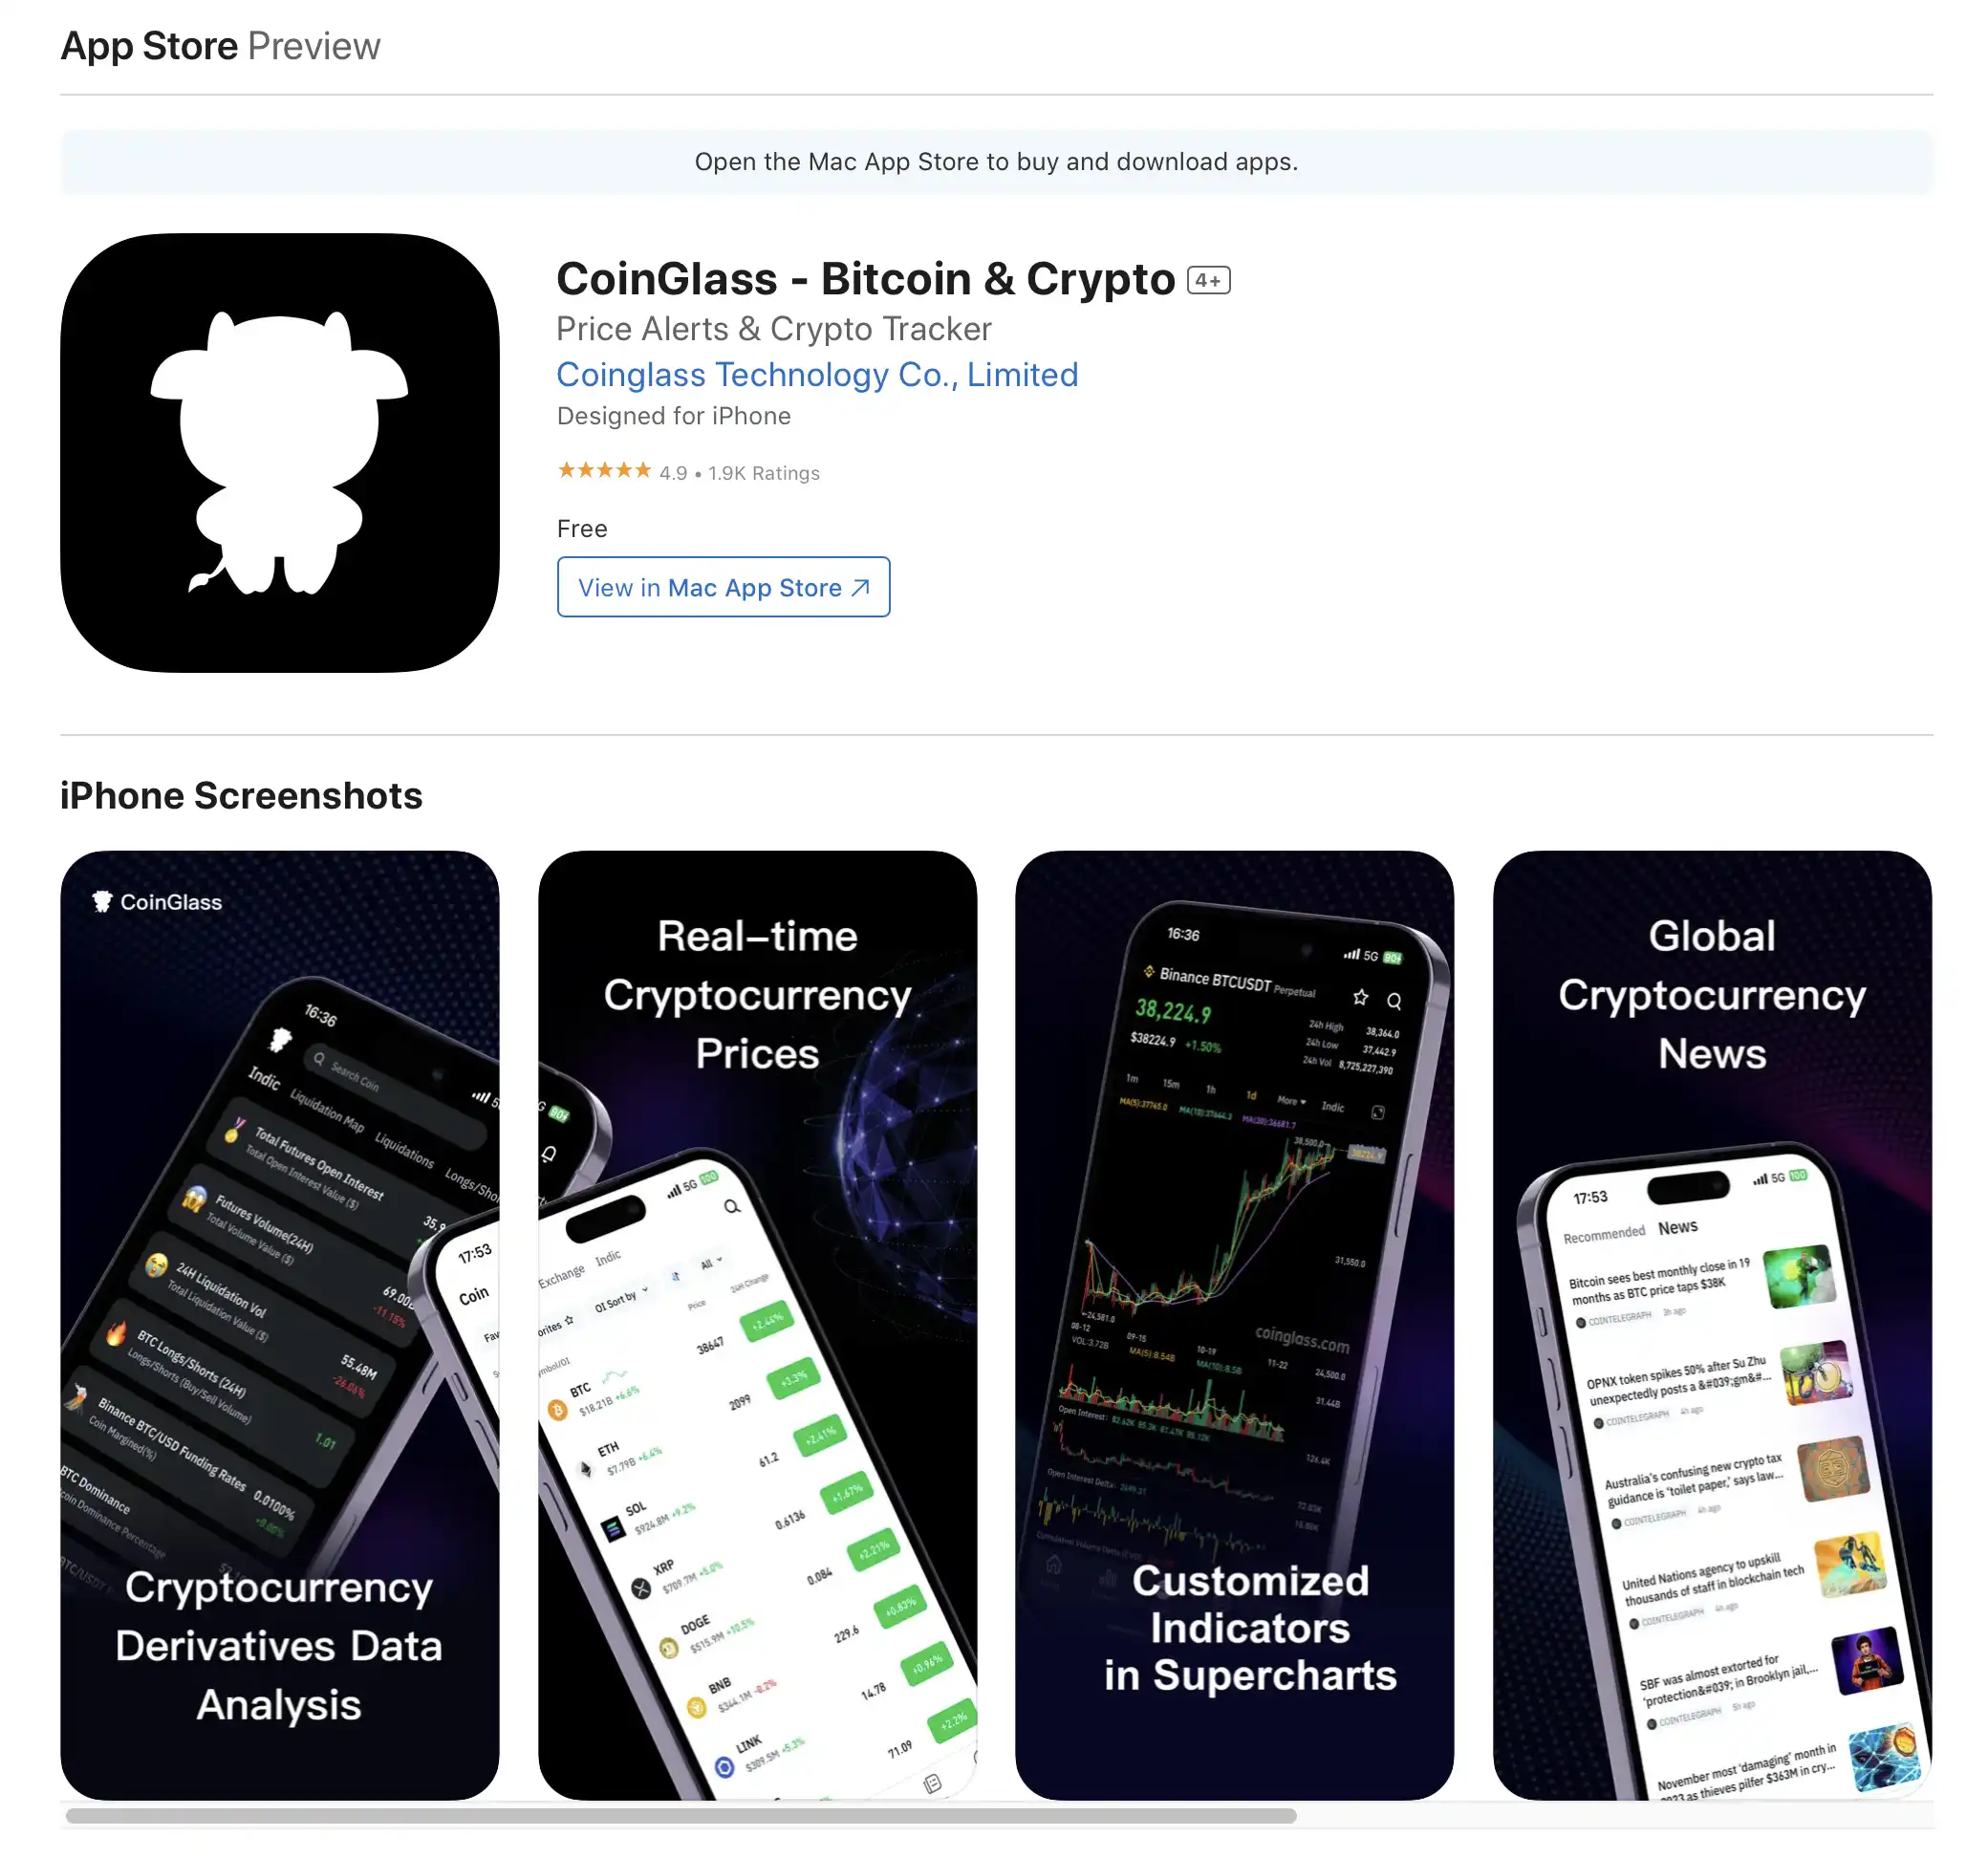
Кстати, у Coinglass также есть свое приложение на IOS и Android.
.webp)
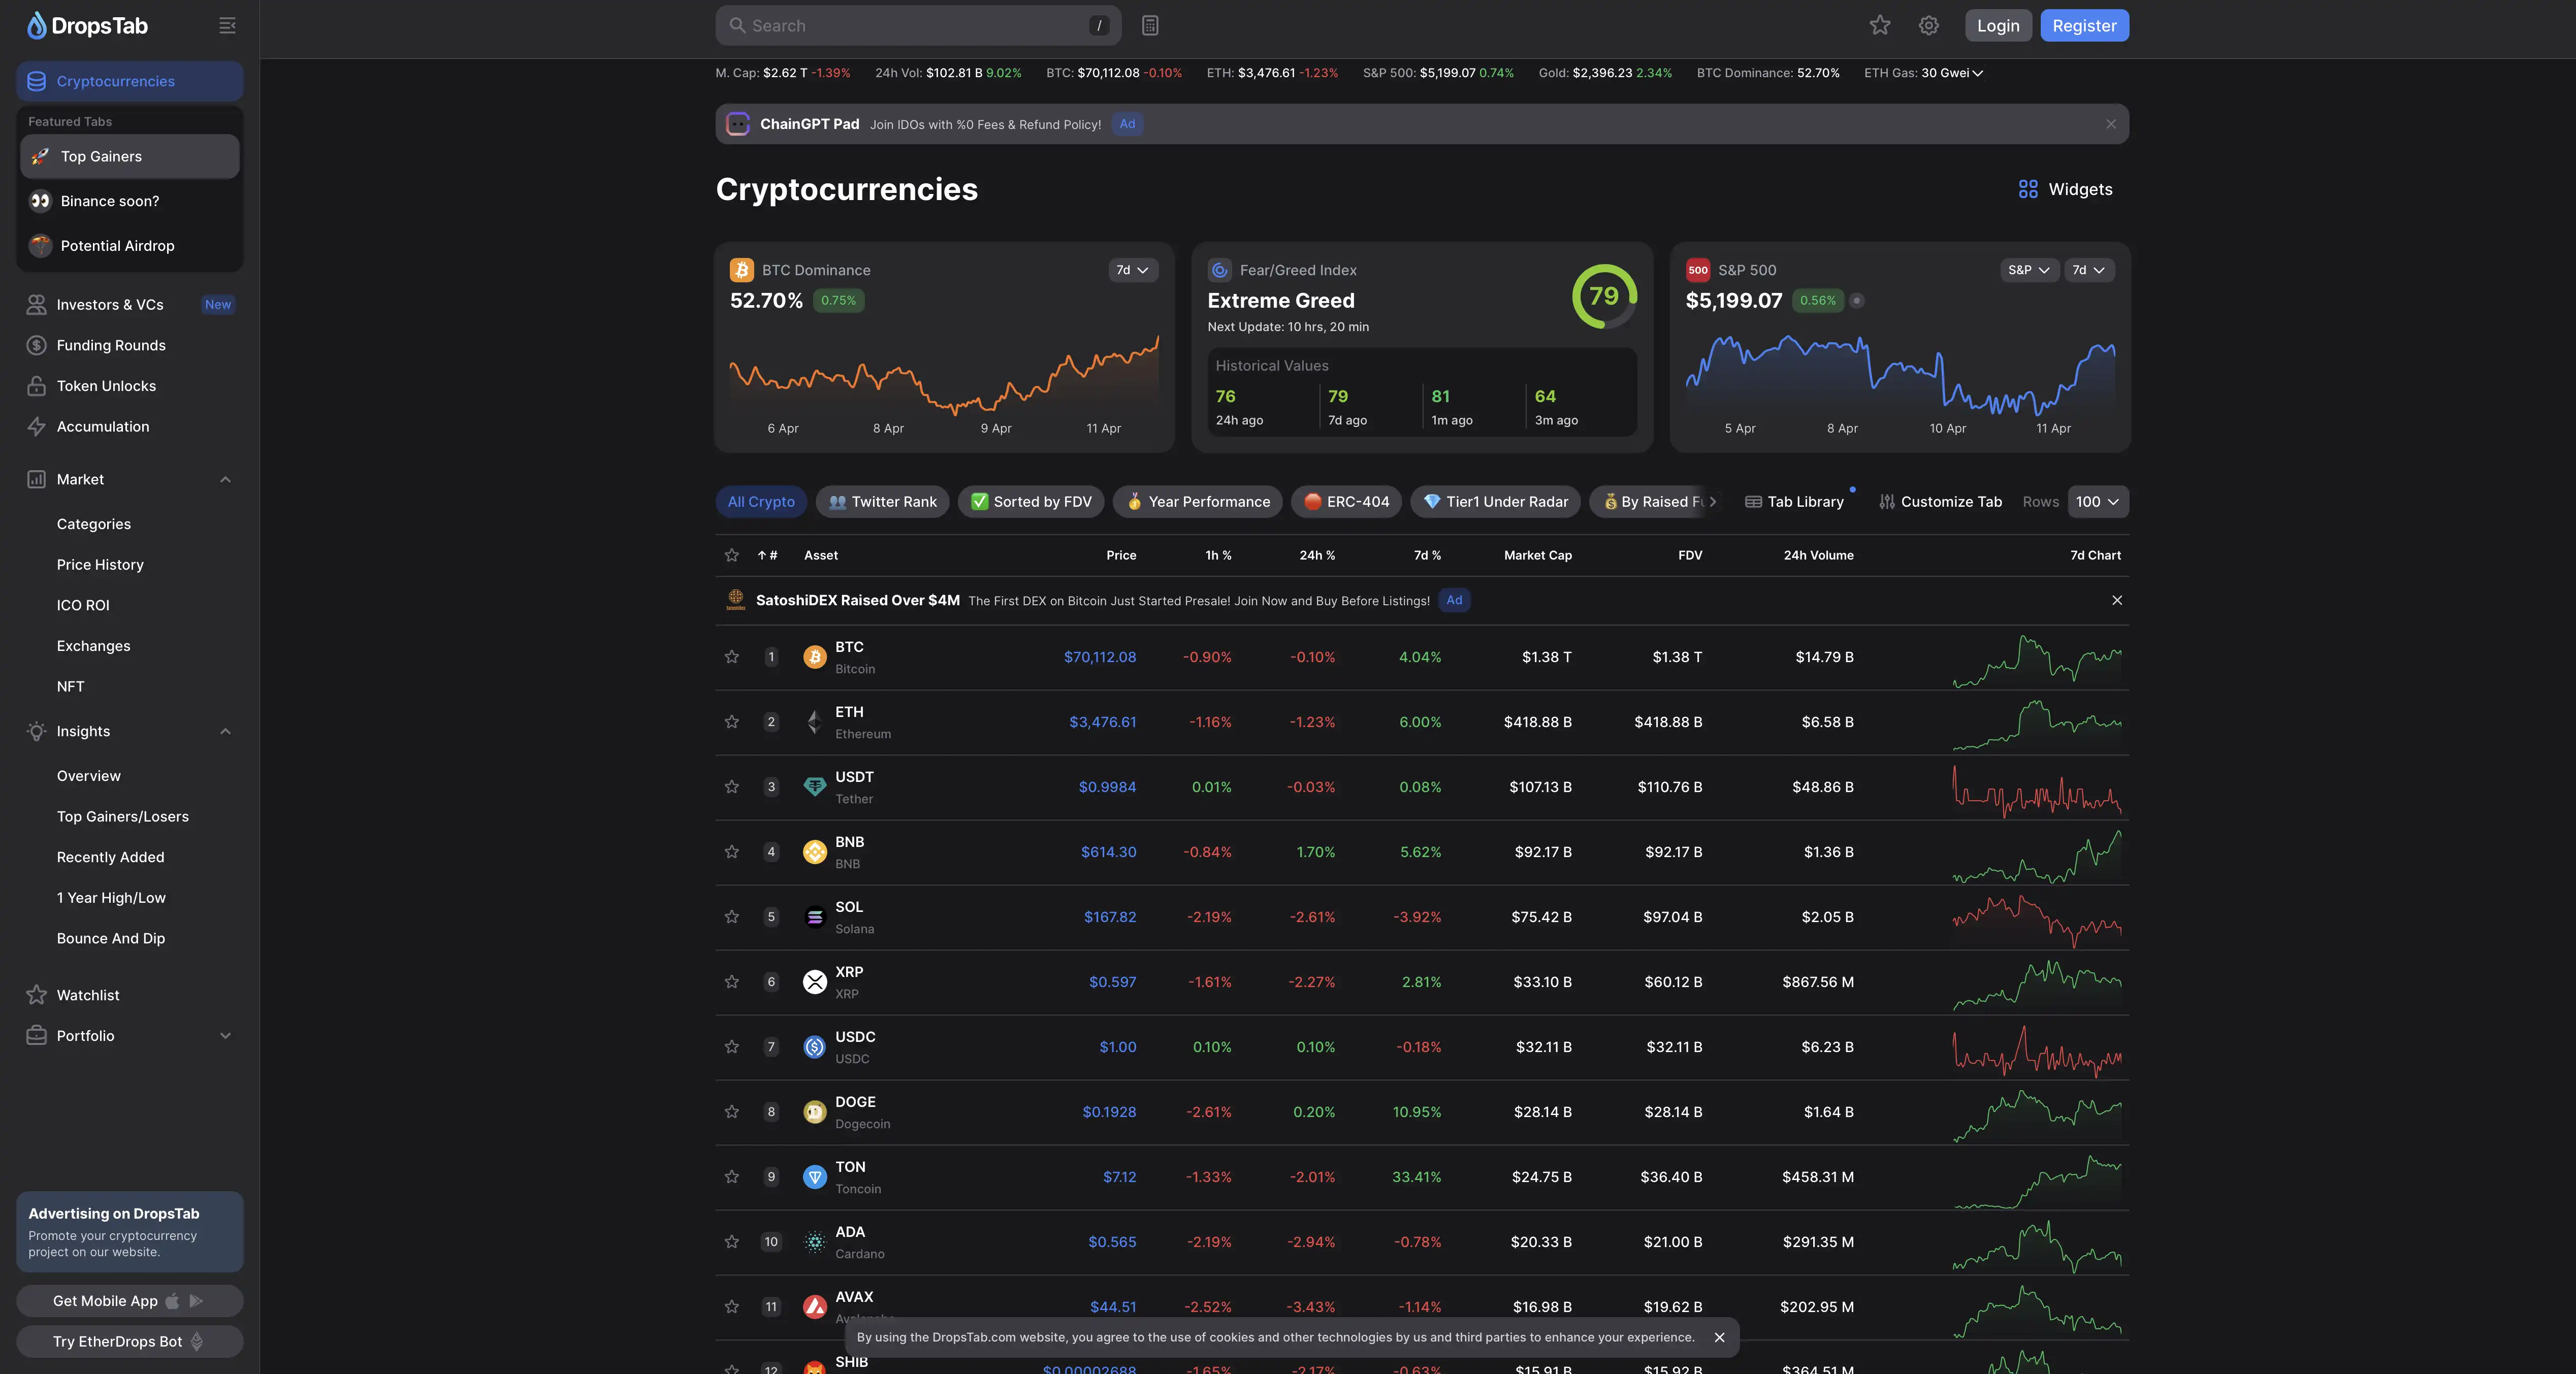
DropsTab
DropsTab — это относительно новый сайт для отслеживания криптовалют, который был запущен в 2019 году.
Этот ресурс принимал участие в Coinlist Seed 2021 и получил поддержку от ICODrops.
Основные функции трекинга на DropsTab аналогичны тем, что предлагают такие конкуренты, как CoinMarketCap и CoinGecko, обеспечивая все необходимые инструменты для мониторинга цен на криптовалюты.
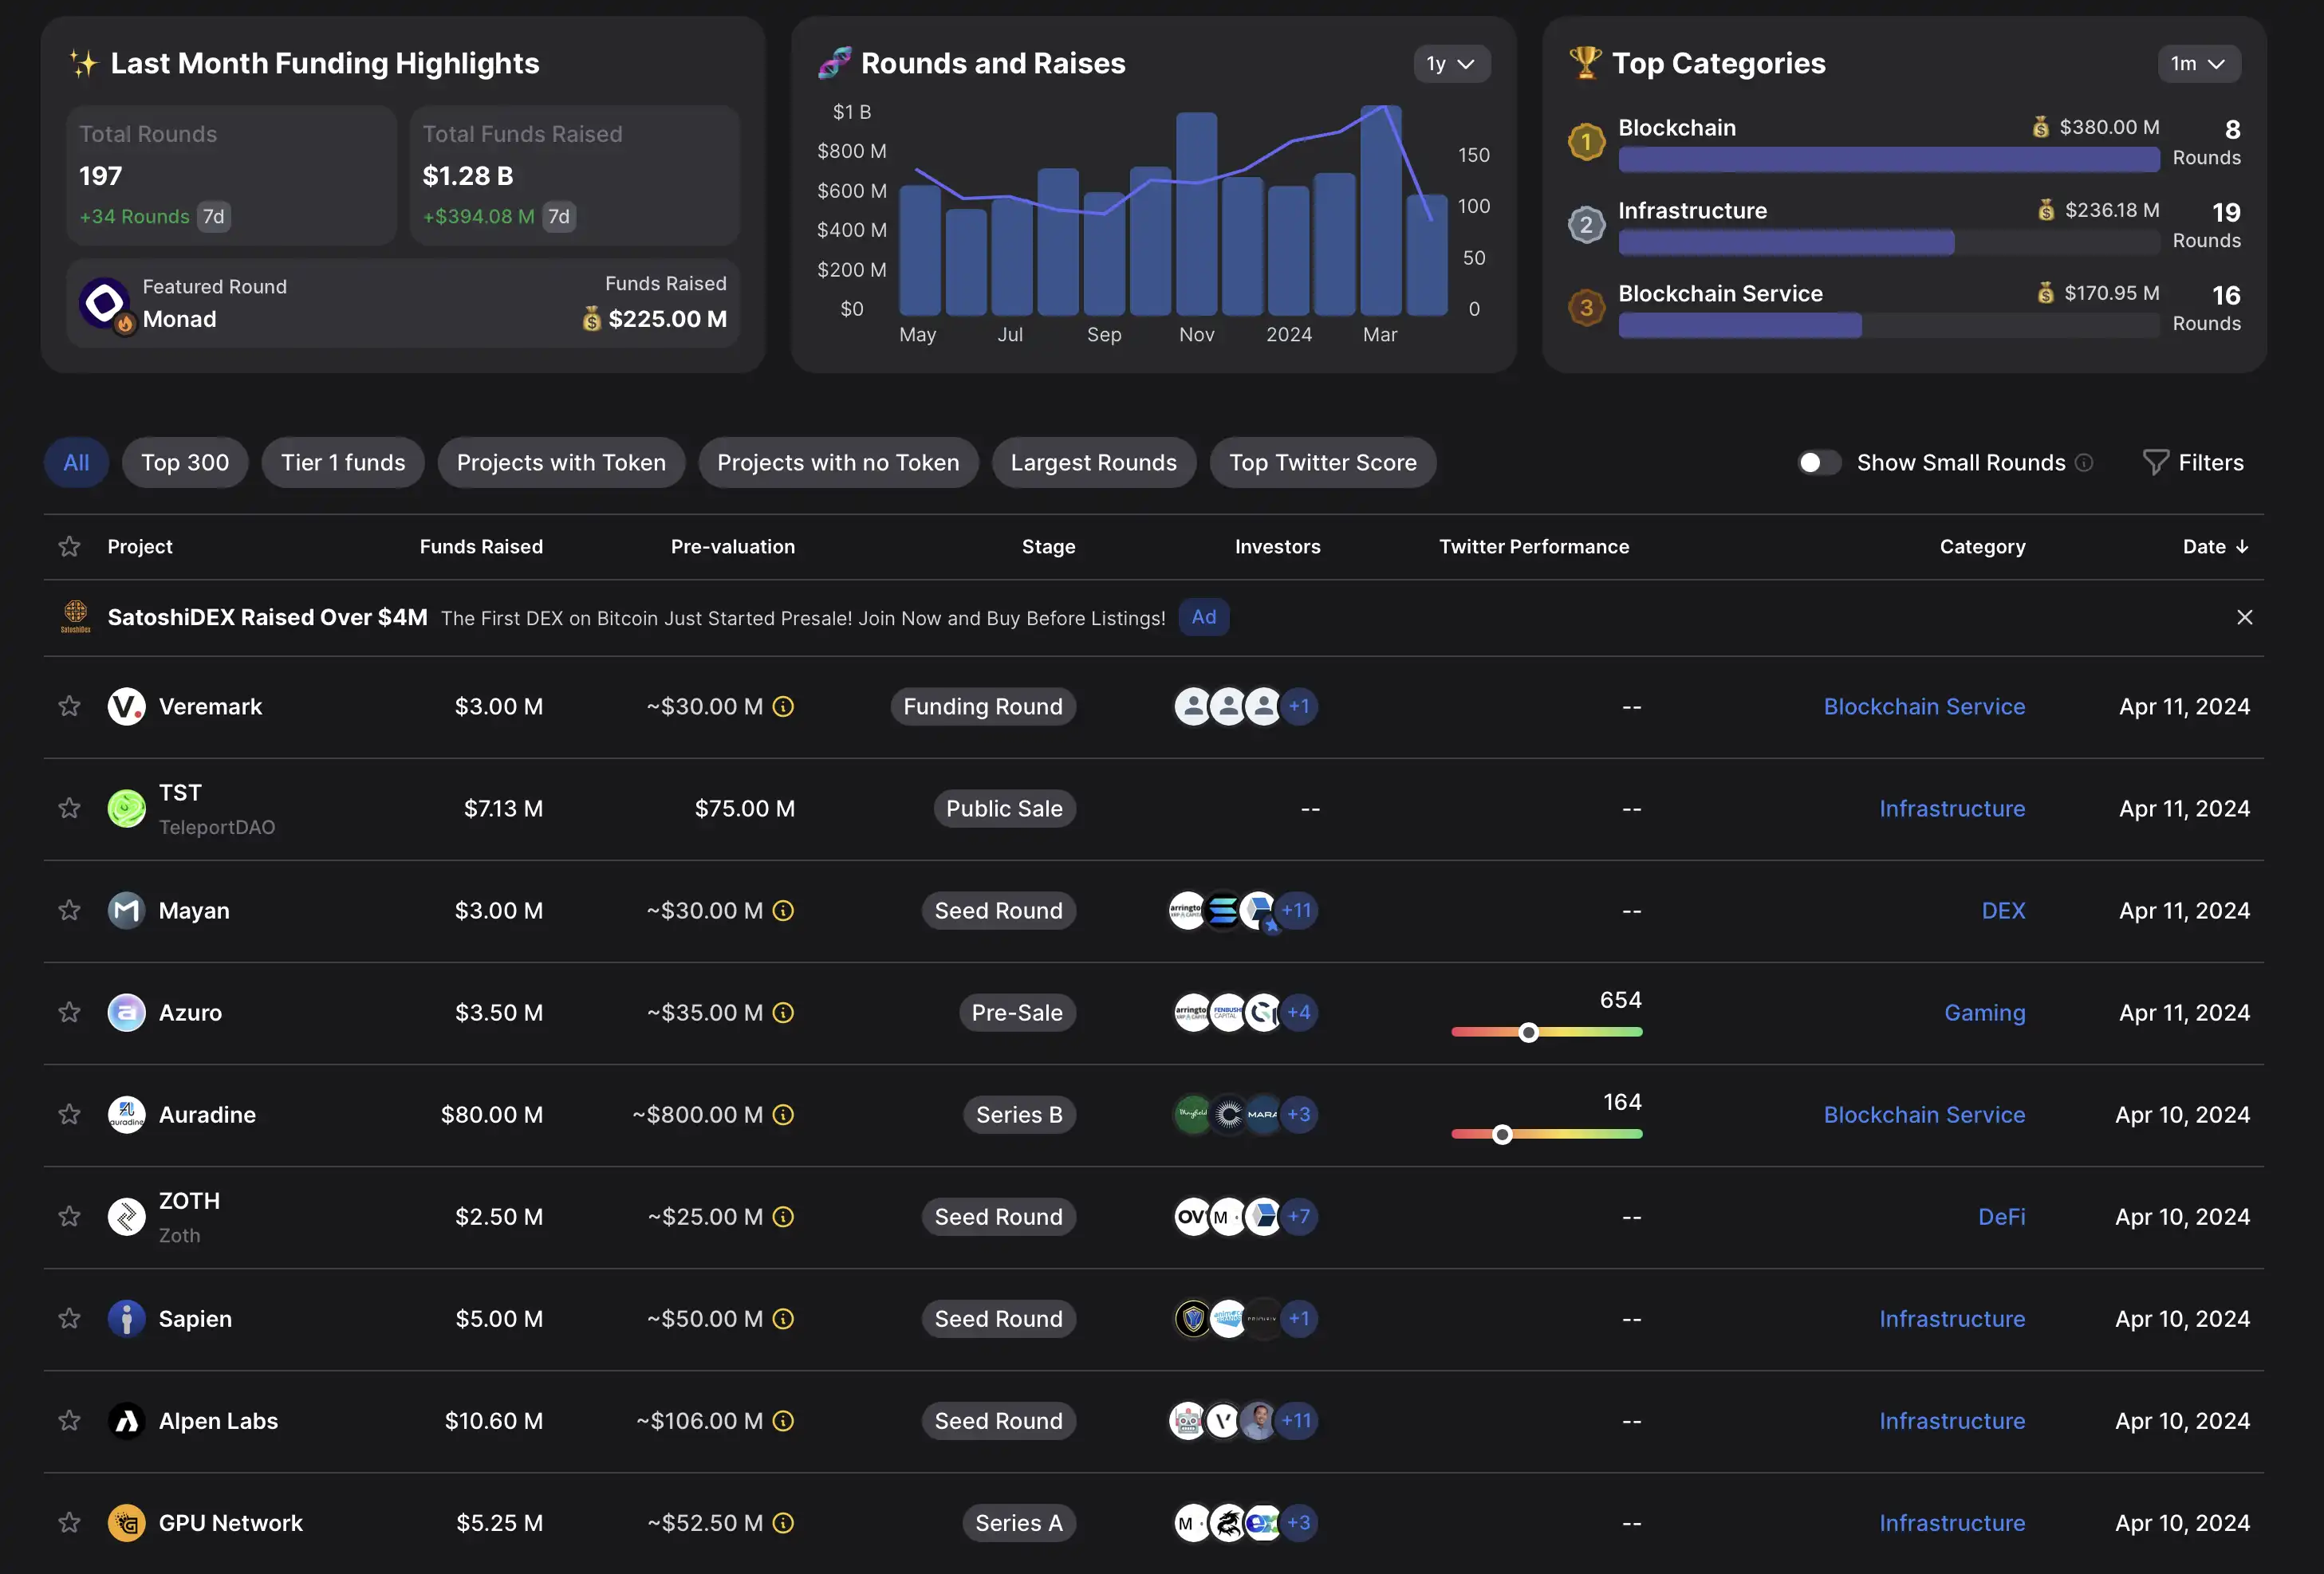
Кроме того, на сервисе можно найти информацию о раундах финансирования, проведенных различными криптовалютными стартапами. Он регулярно обновляется и отражает самую свежую информацию, что делает его ценным инструментом для инвесторов, предпринимателей и криптоэнтузиастов, которые хотят отслеживать последние мероприятия по привлечению средств в отрасли.
Еще одним интересным разделом является разблокировка токенов – это определенные даты, когда проект собирается влить в рынок дополнительное предложение, которое было недоступно ранее. Это крайне важный трекер, так как все мы знаем, как избыточное предложение может влиять на цену актива...
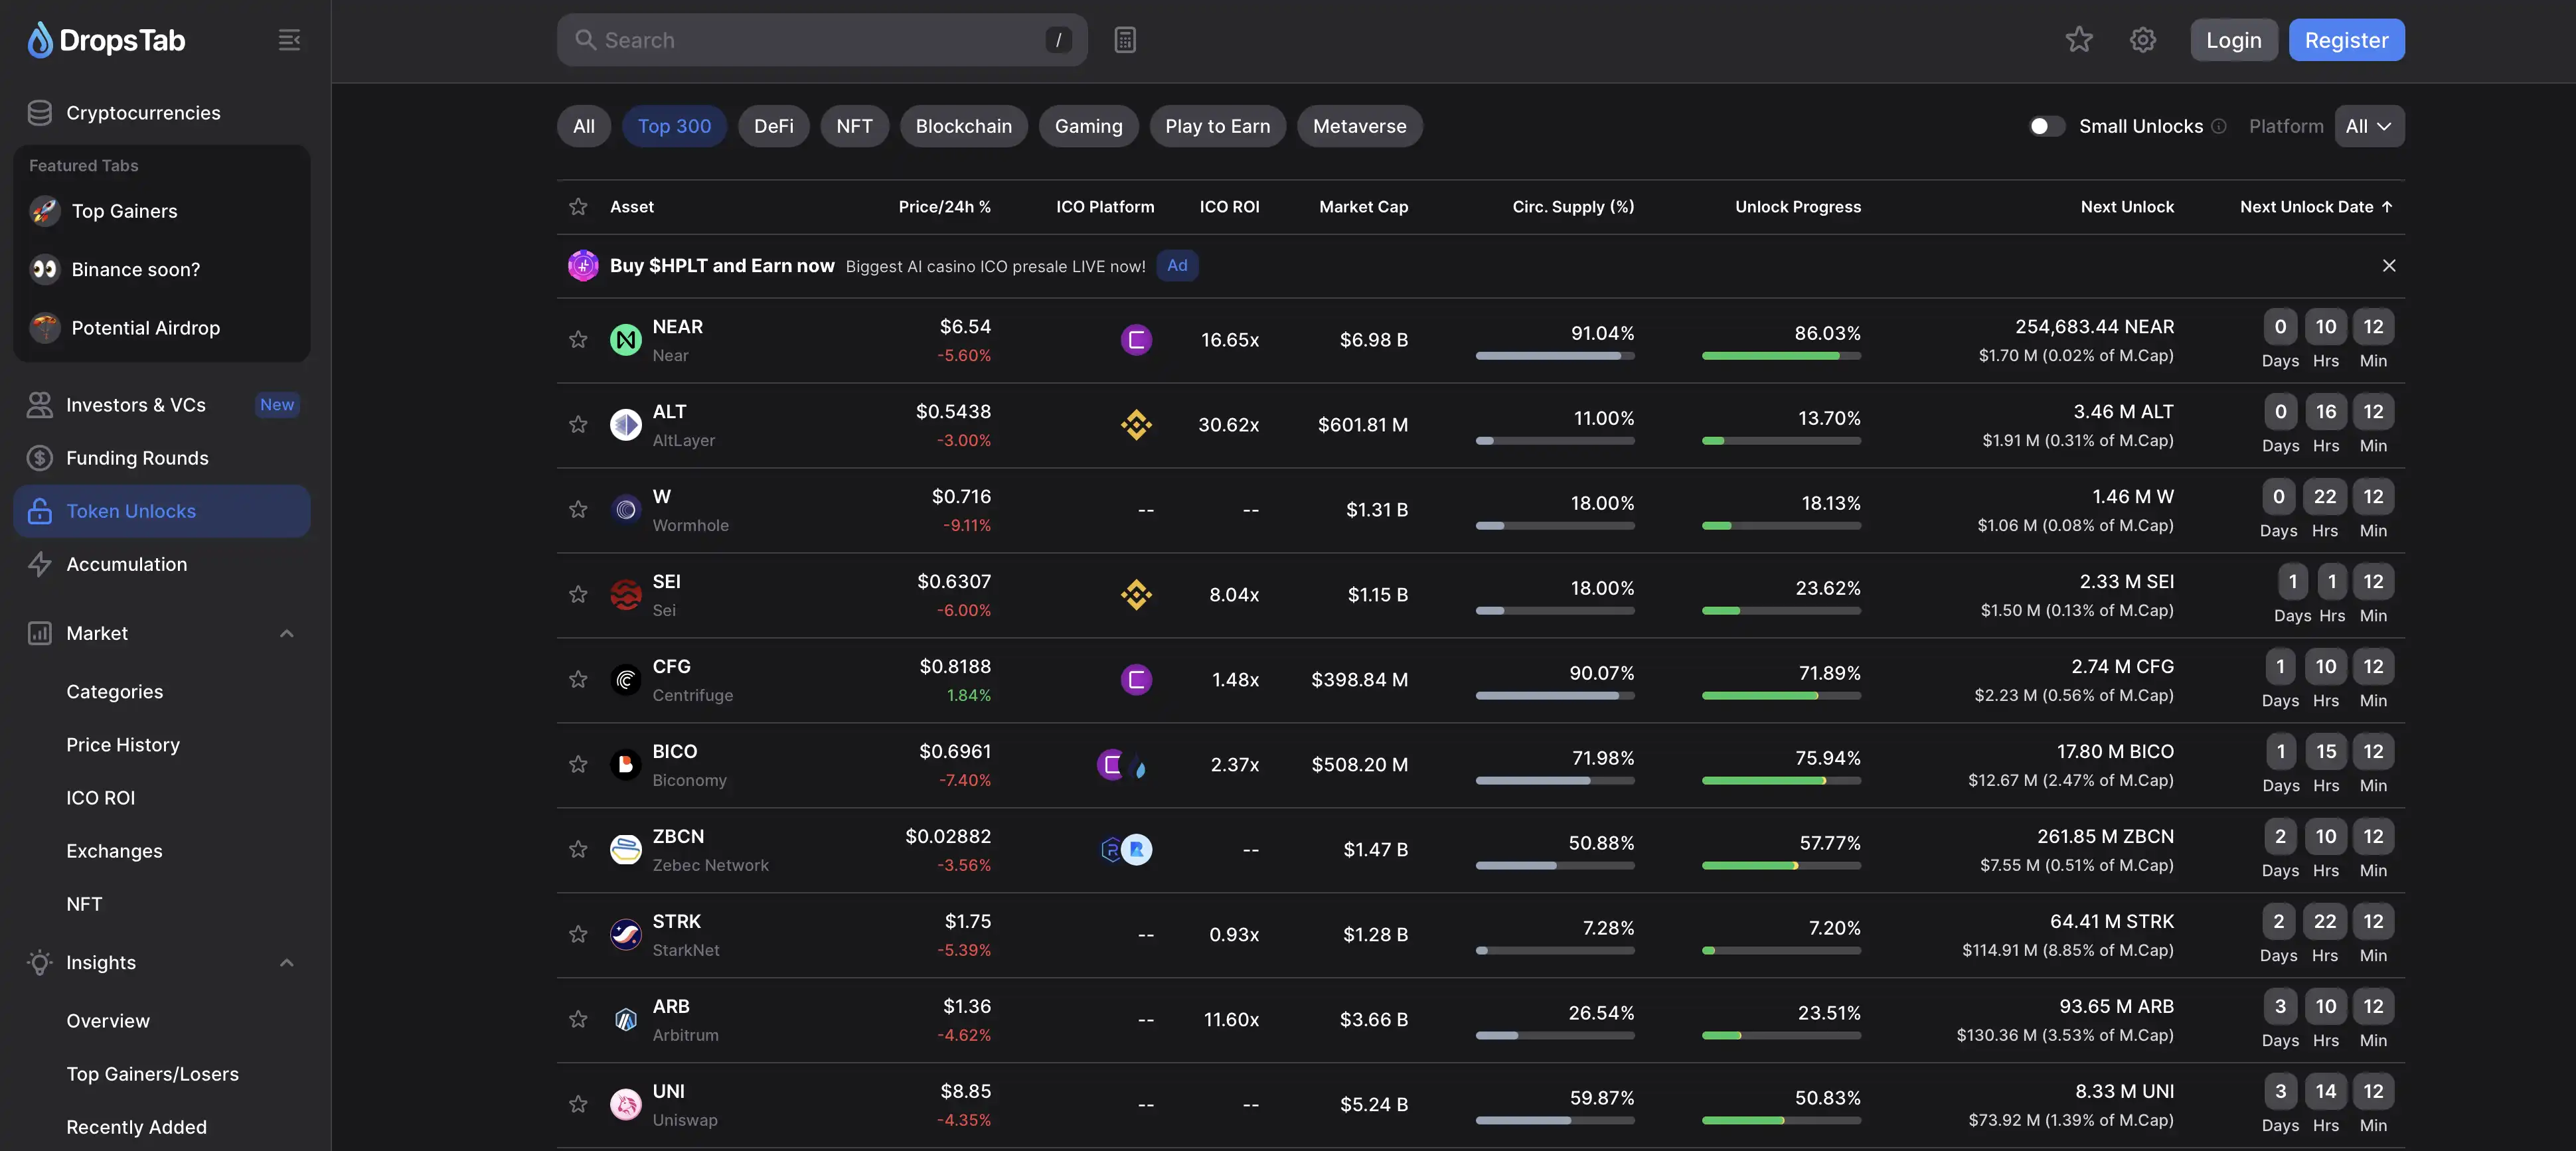
Особенно интересно, что на платформе есть отдельная вкладка, посвященная токенам, на которые позарились SEC. Здесь можно получить информацию о токенах и их регулировании Комиссией по ценным бумагам и биржам США. Подробный материал о монетах, которые находятся под угрозой.
.webp)
DropsTab также предлагает пользователям создать и трекать свой портфель на платформе: отметим, что это наиболее удобный сервис для отслеживания своего портфолио. Юзеры также могут делиться ссылкой на свой портфель с друзьями или знакомыми.
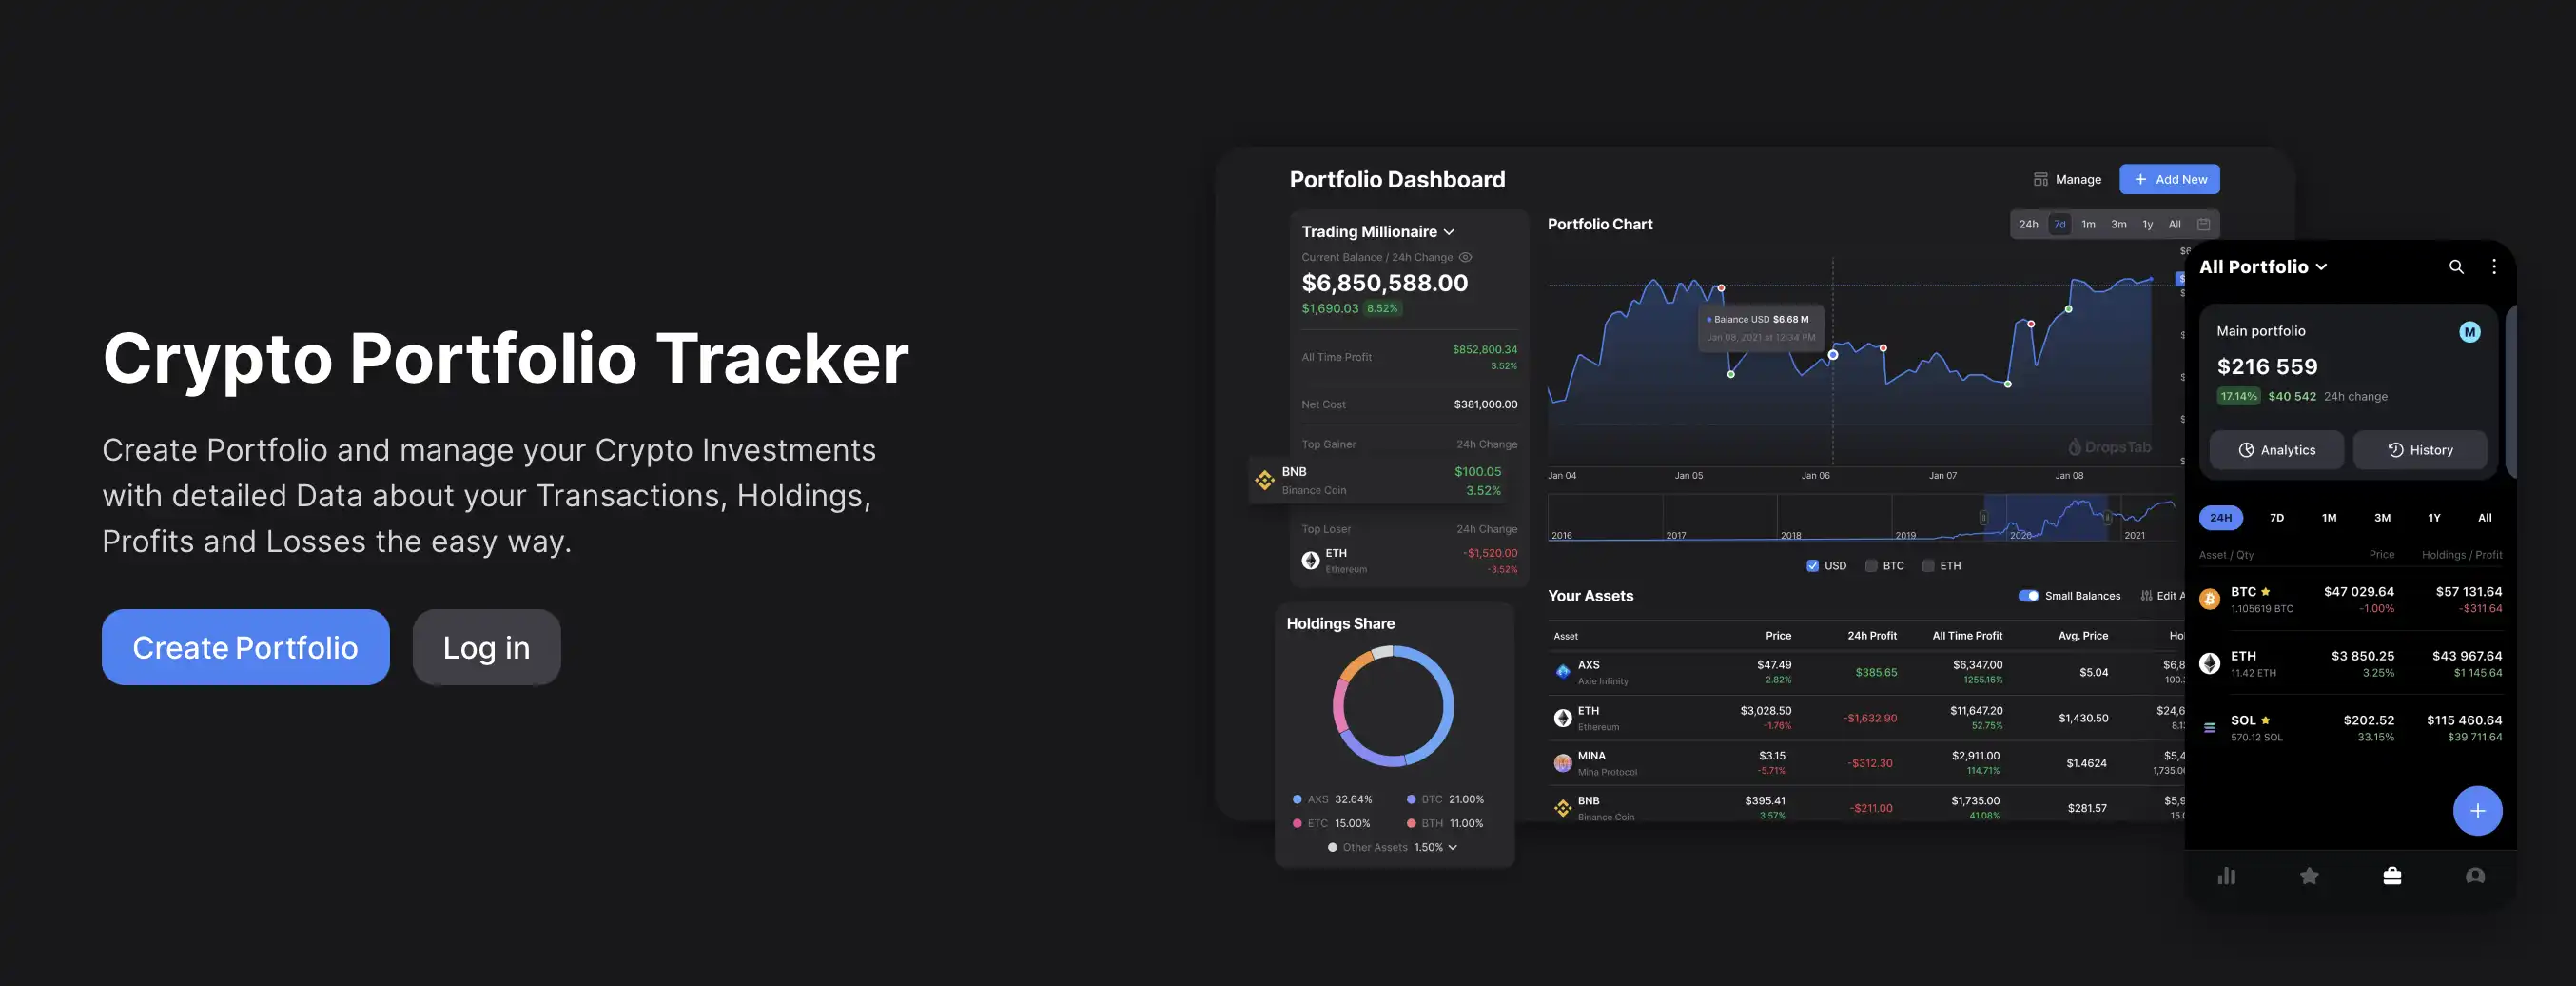
Здесь также можно найти информацию, посвященную объемам торгов на биржах, популярным NFT, ICO и многому другому.
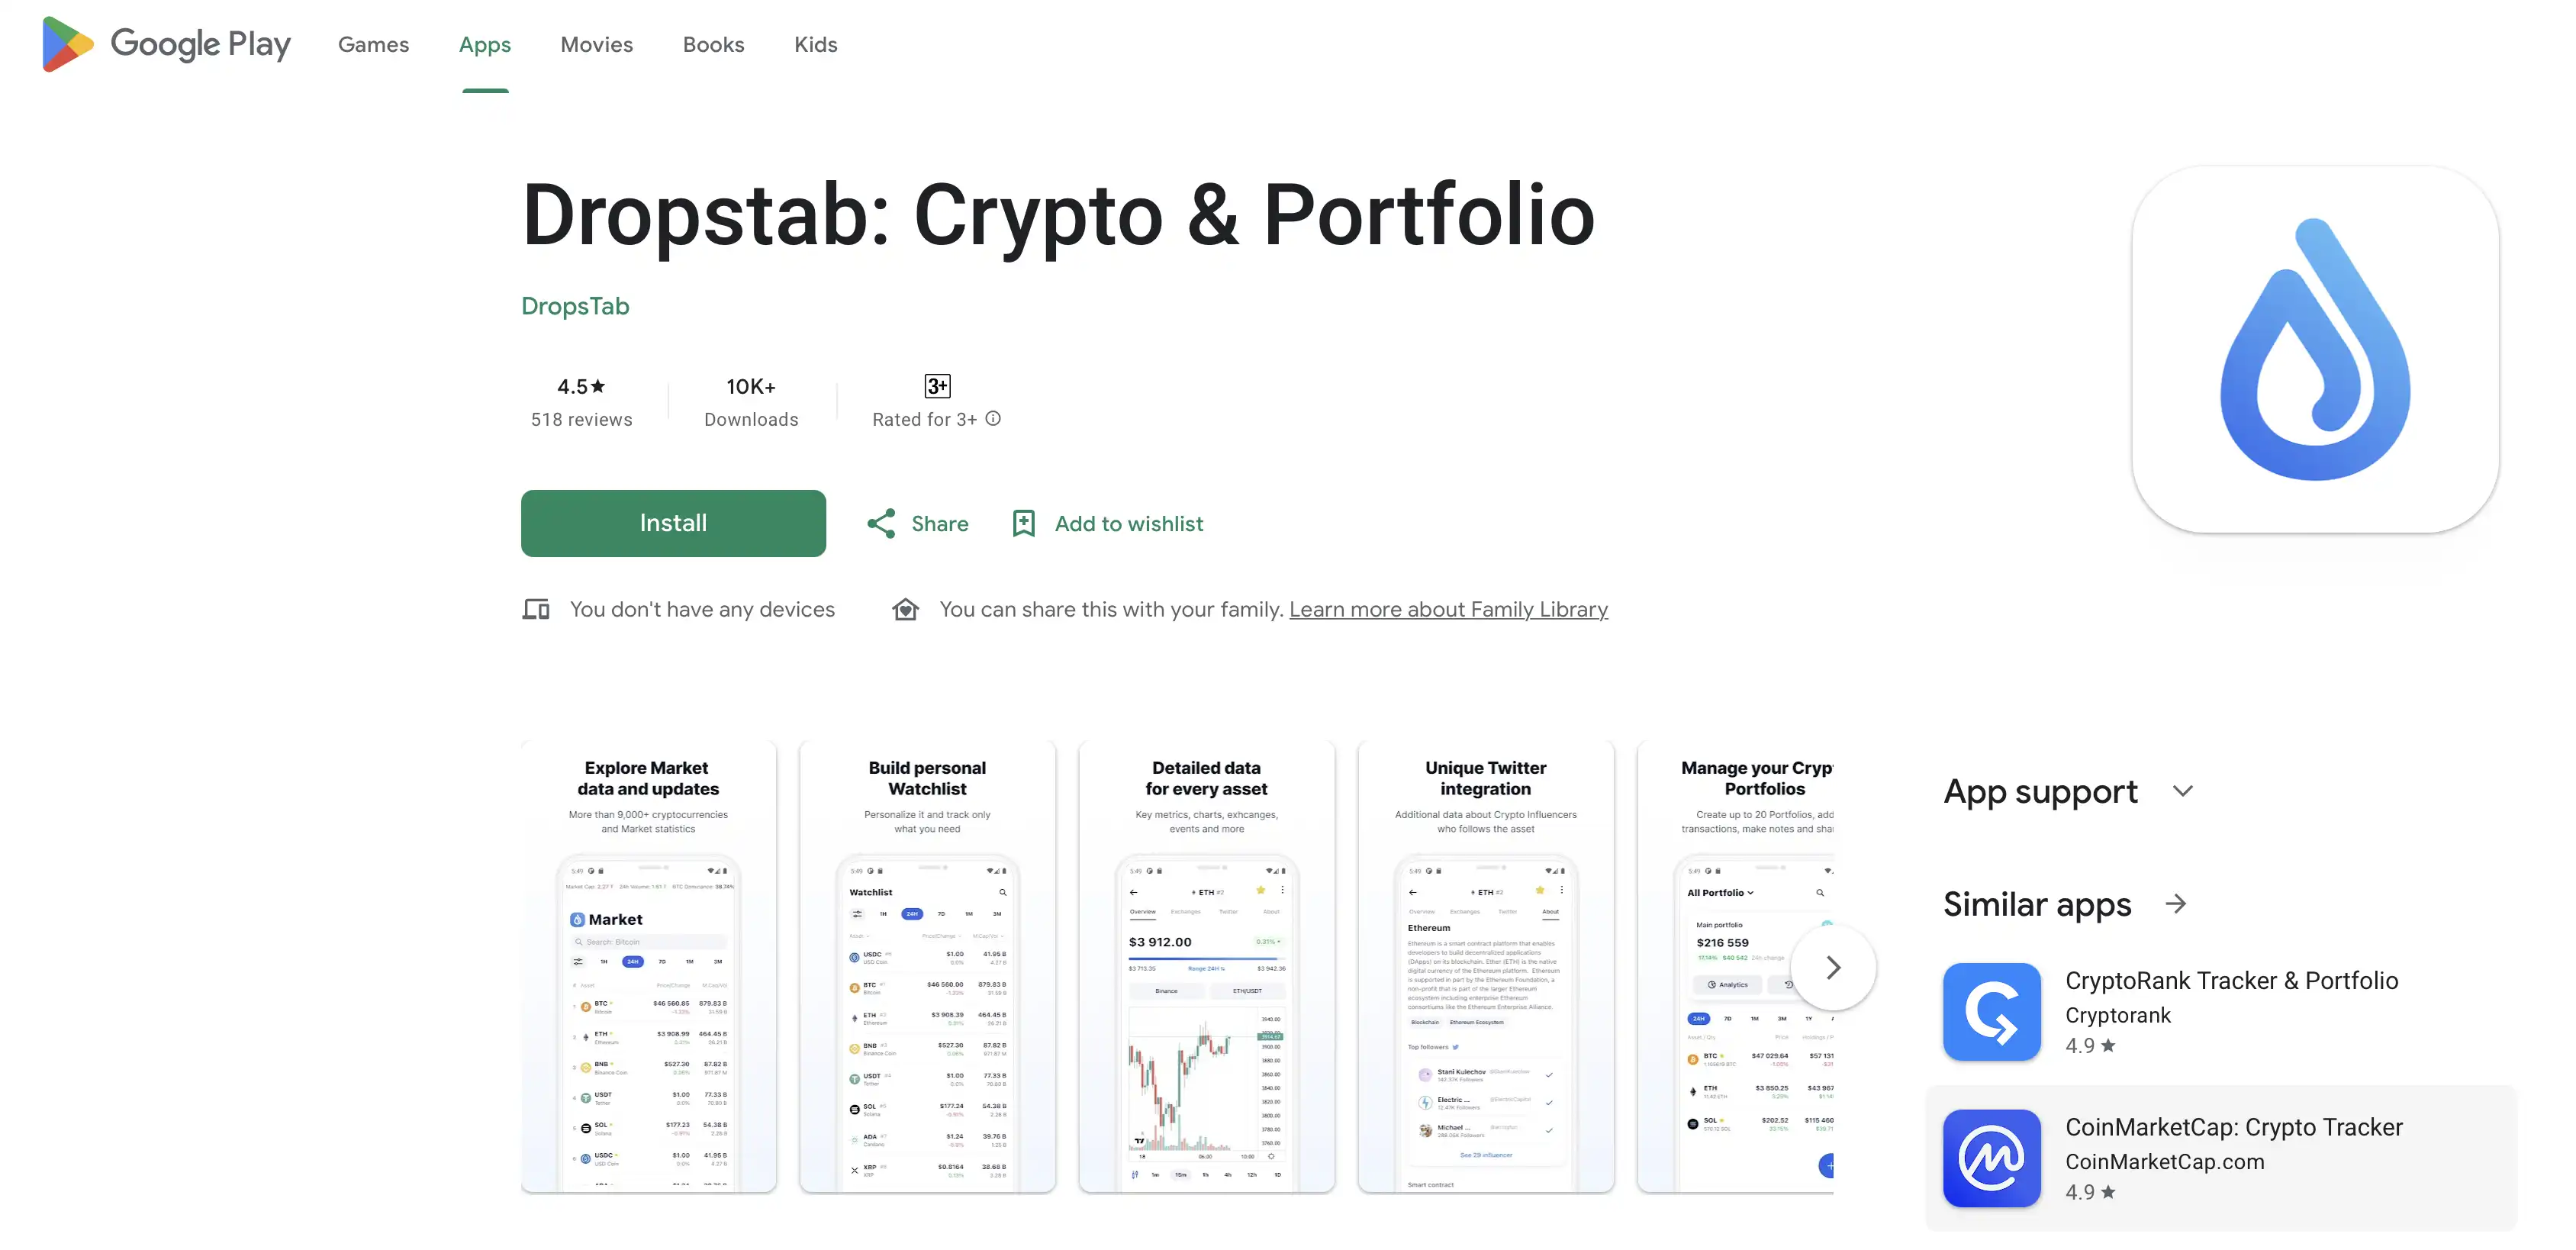
DropsTab также можно загрузить на IOS и Android.

Messari
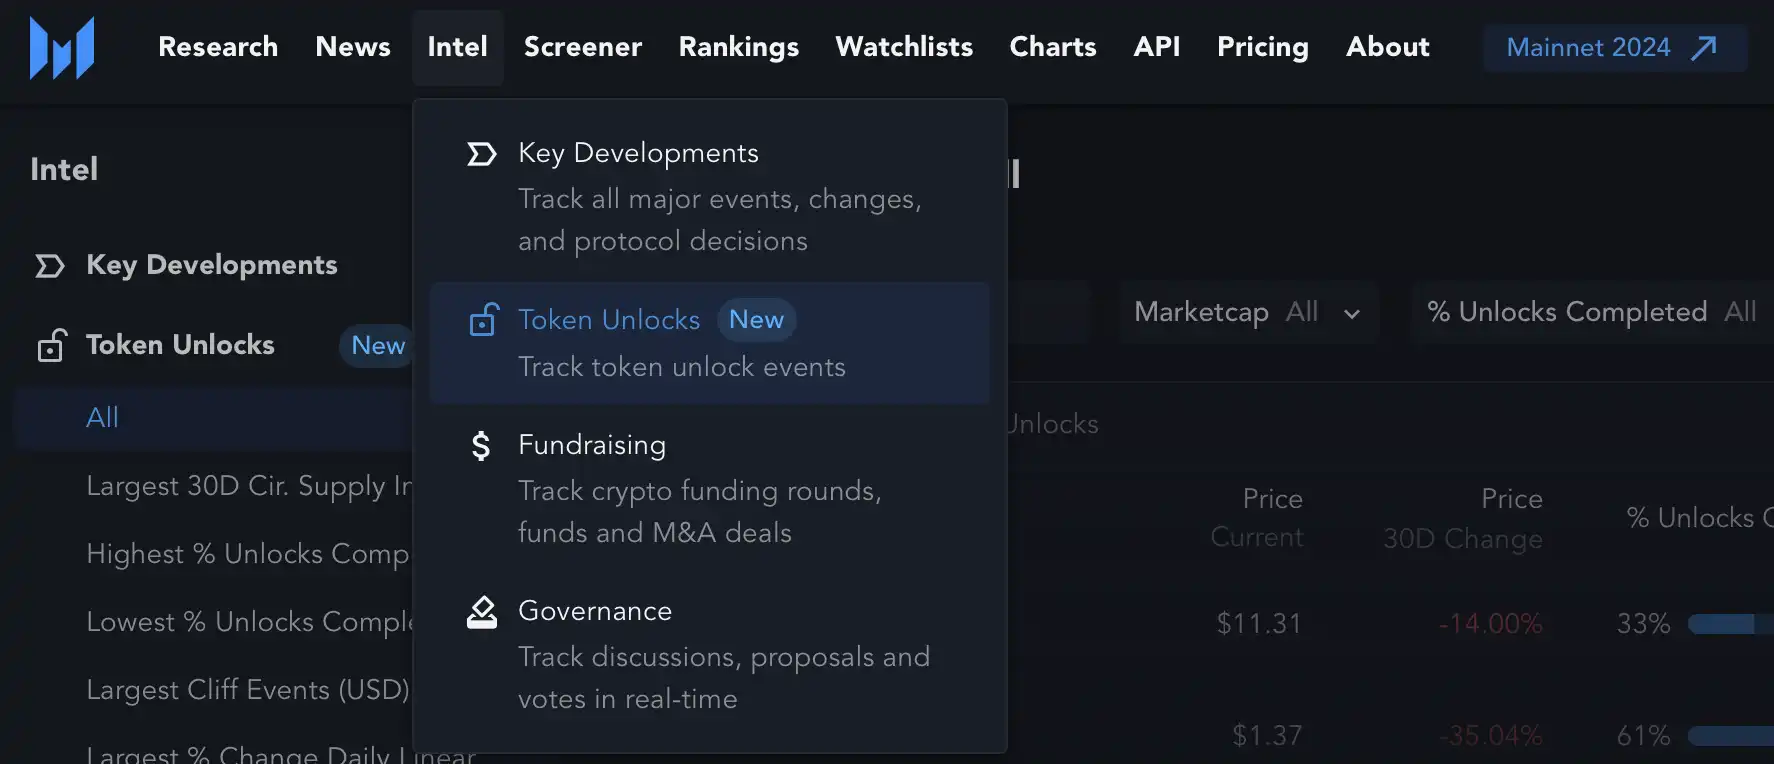
Messari.io является агрегатором данных о криптовалютном рынке, который предлагает широкий спектр аналитических инструментов для мониторинга как отдельно взятых токенов, так и рынка в целом. На этой платформе также можно найти актуальную информацию о предстоящих листингах, токенсейлах, аирдропах и других значимых событиях в сфере криптовалют.
Проект Messari был запущен в 2018 году и предлагает широкие возможности для анализа криптовалютного рынка. Платформа аккумулирует информацию о различных крипто-событиях, таких, как листинги и токенсейлы, а также новости рынка. Messari предоставляет три уровня доступа: бесплатный, платная подписка Messari Pro и корпоративная подписка Messari Enterprise.
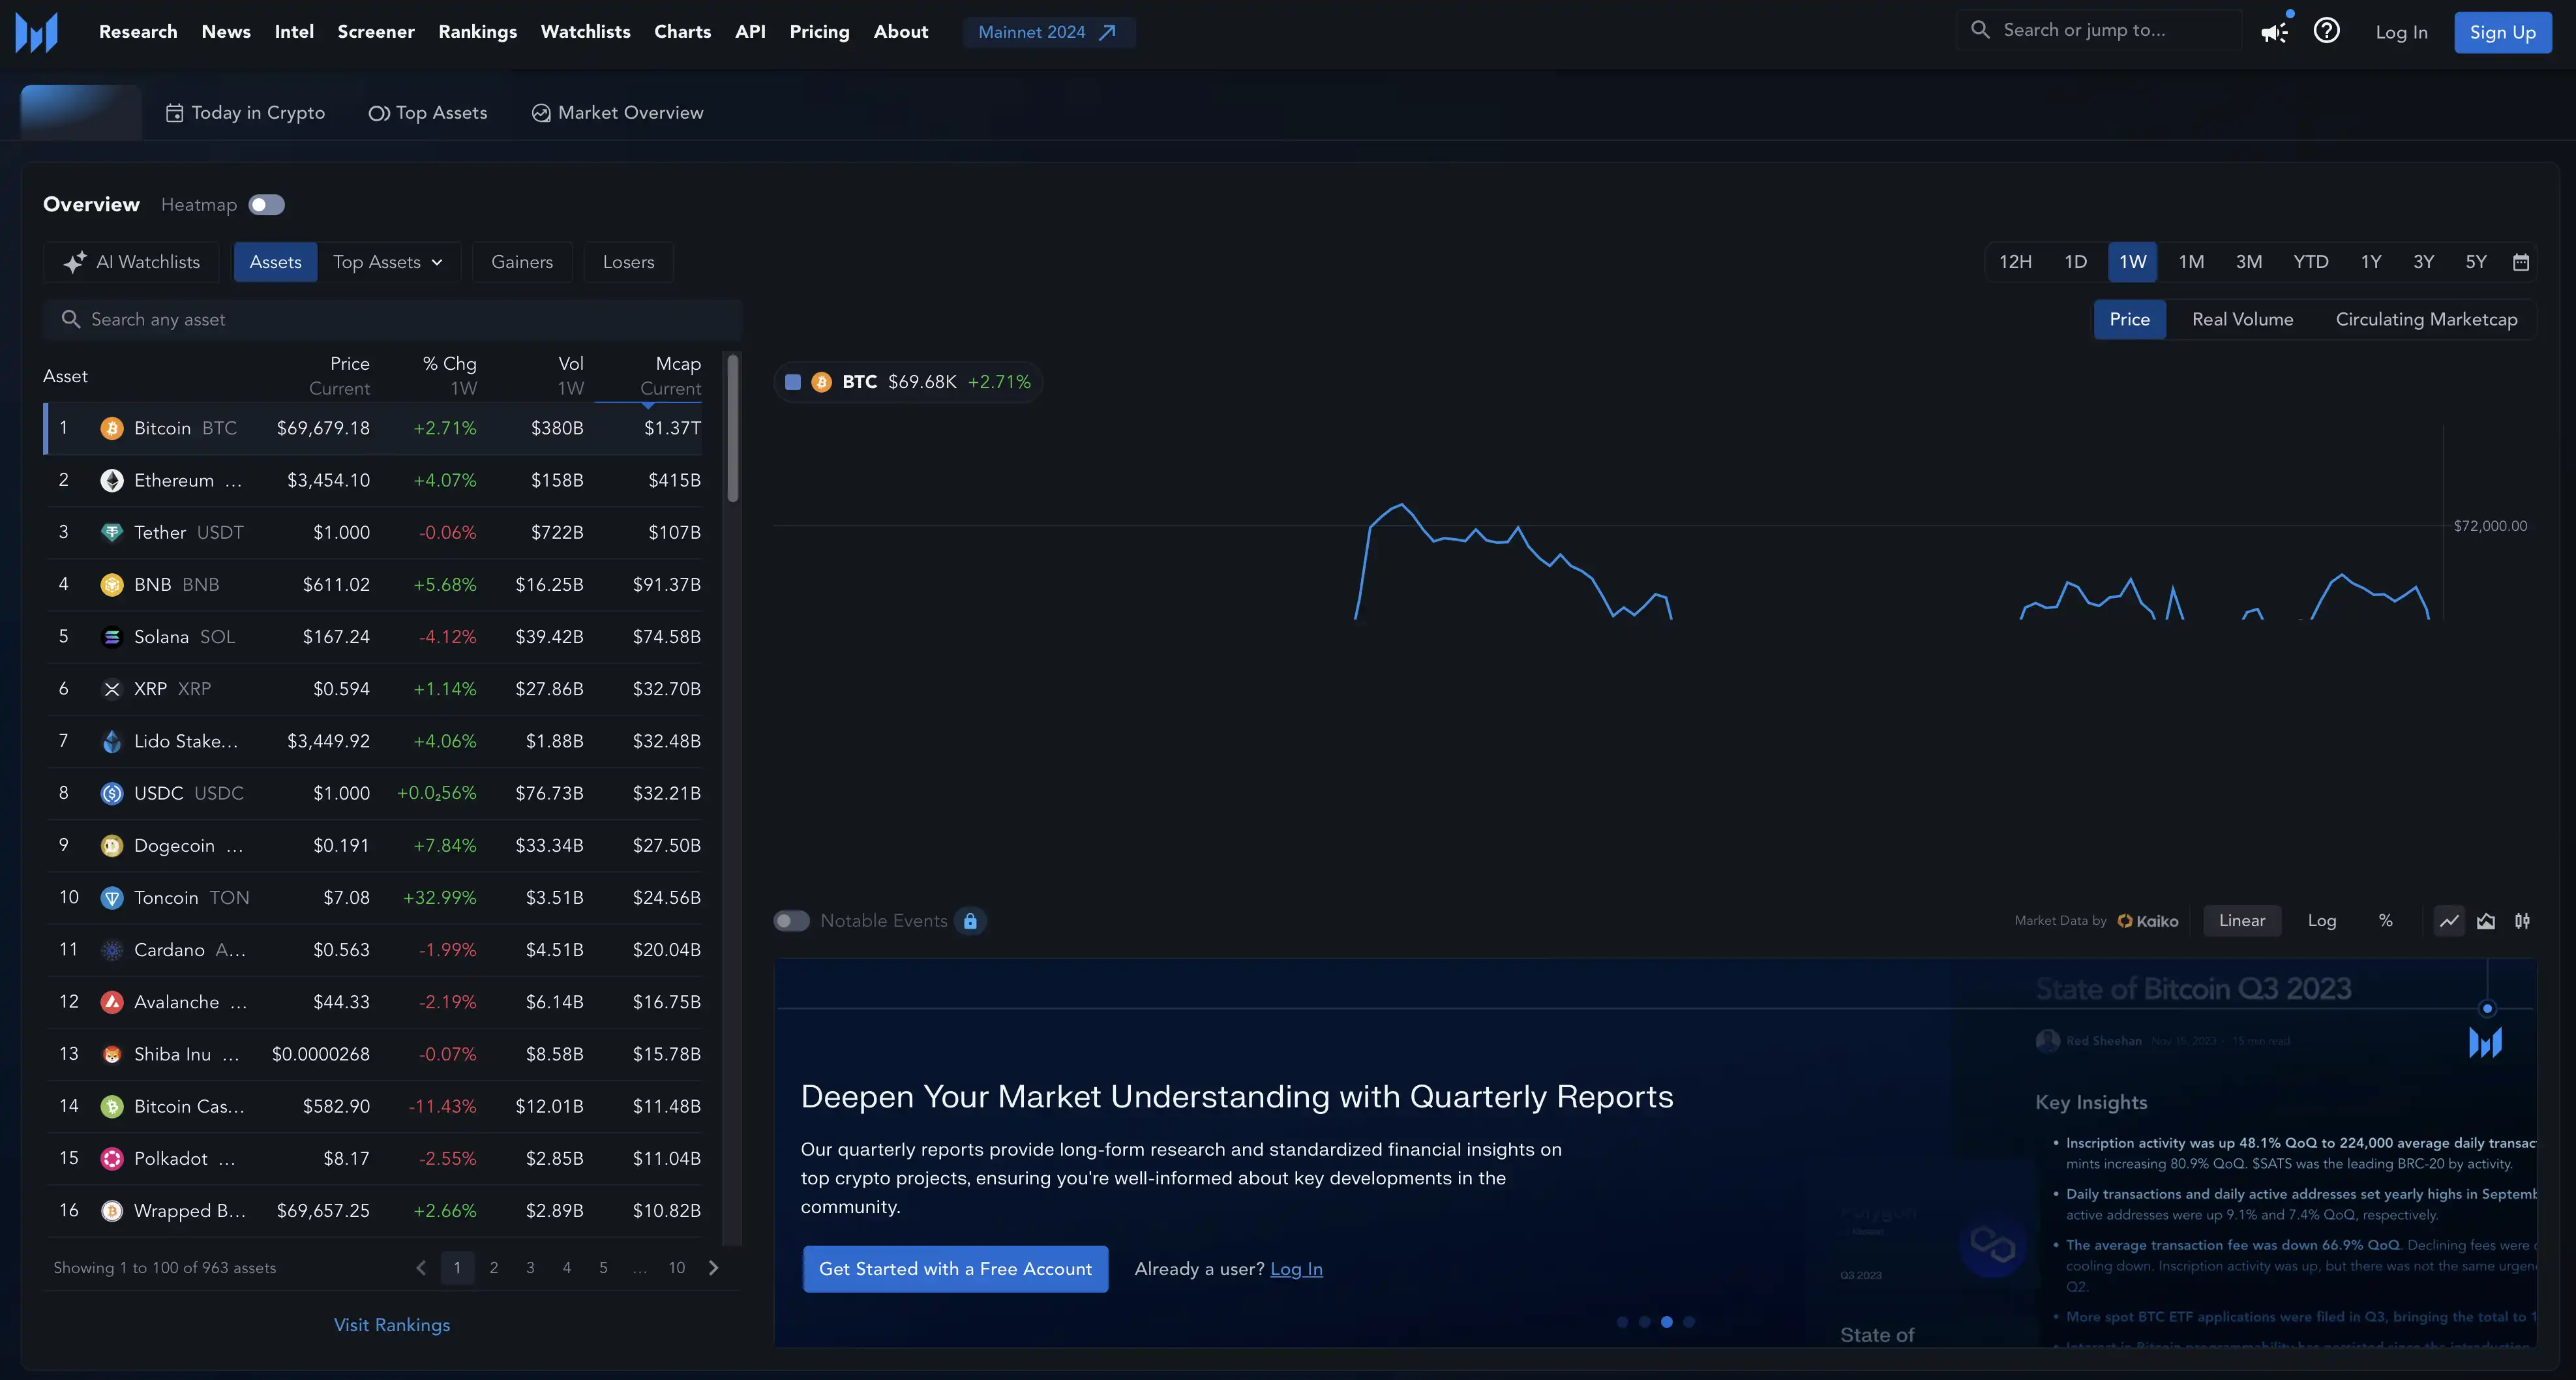
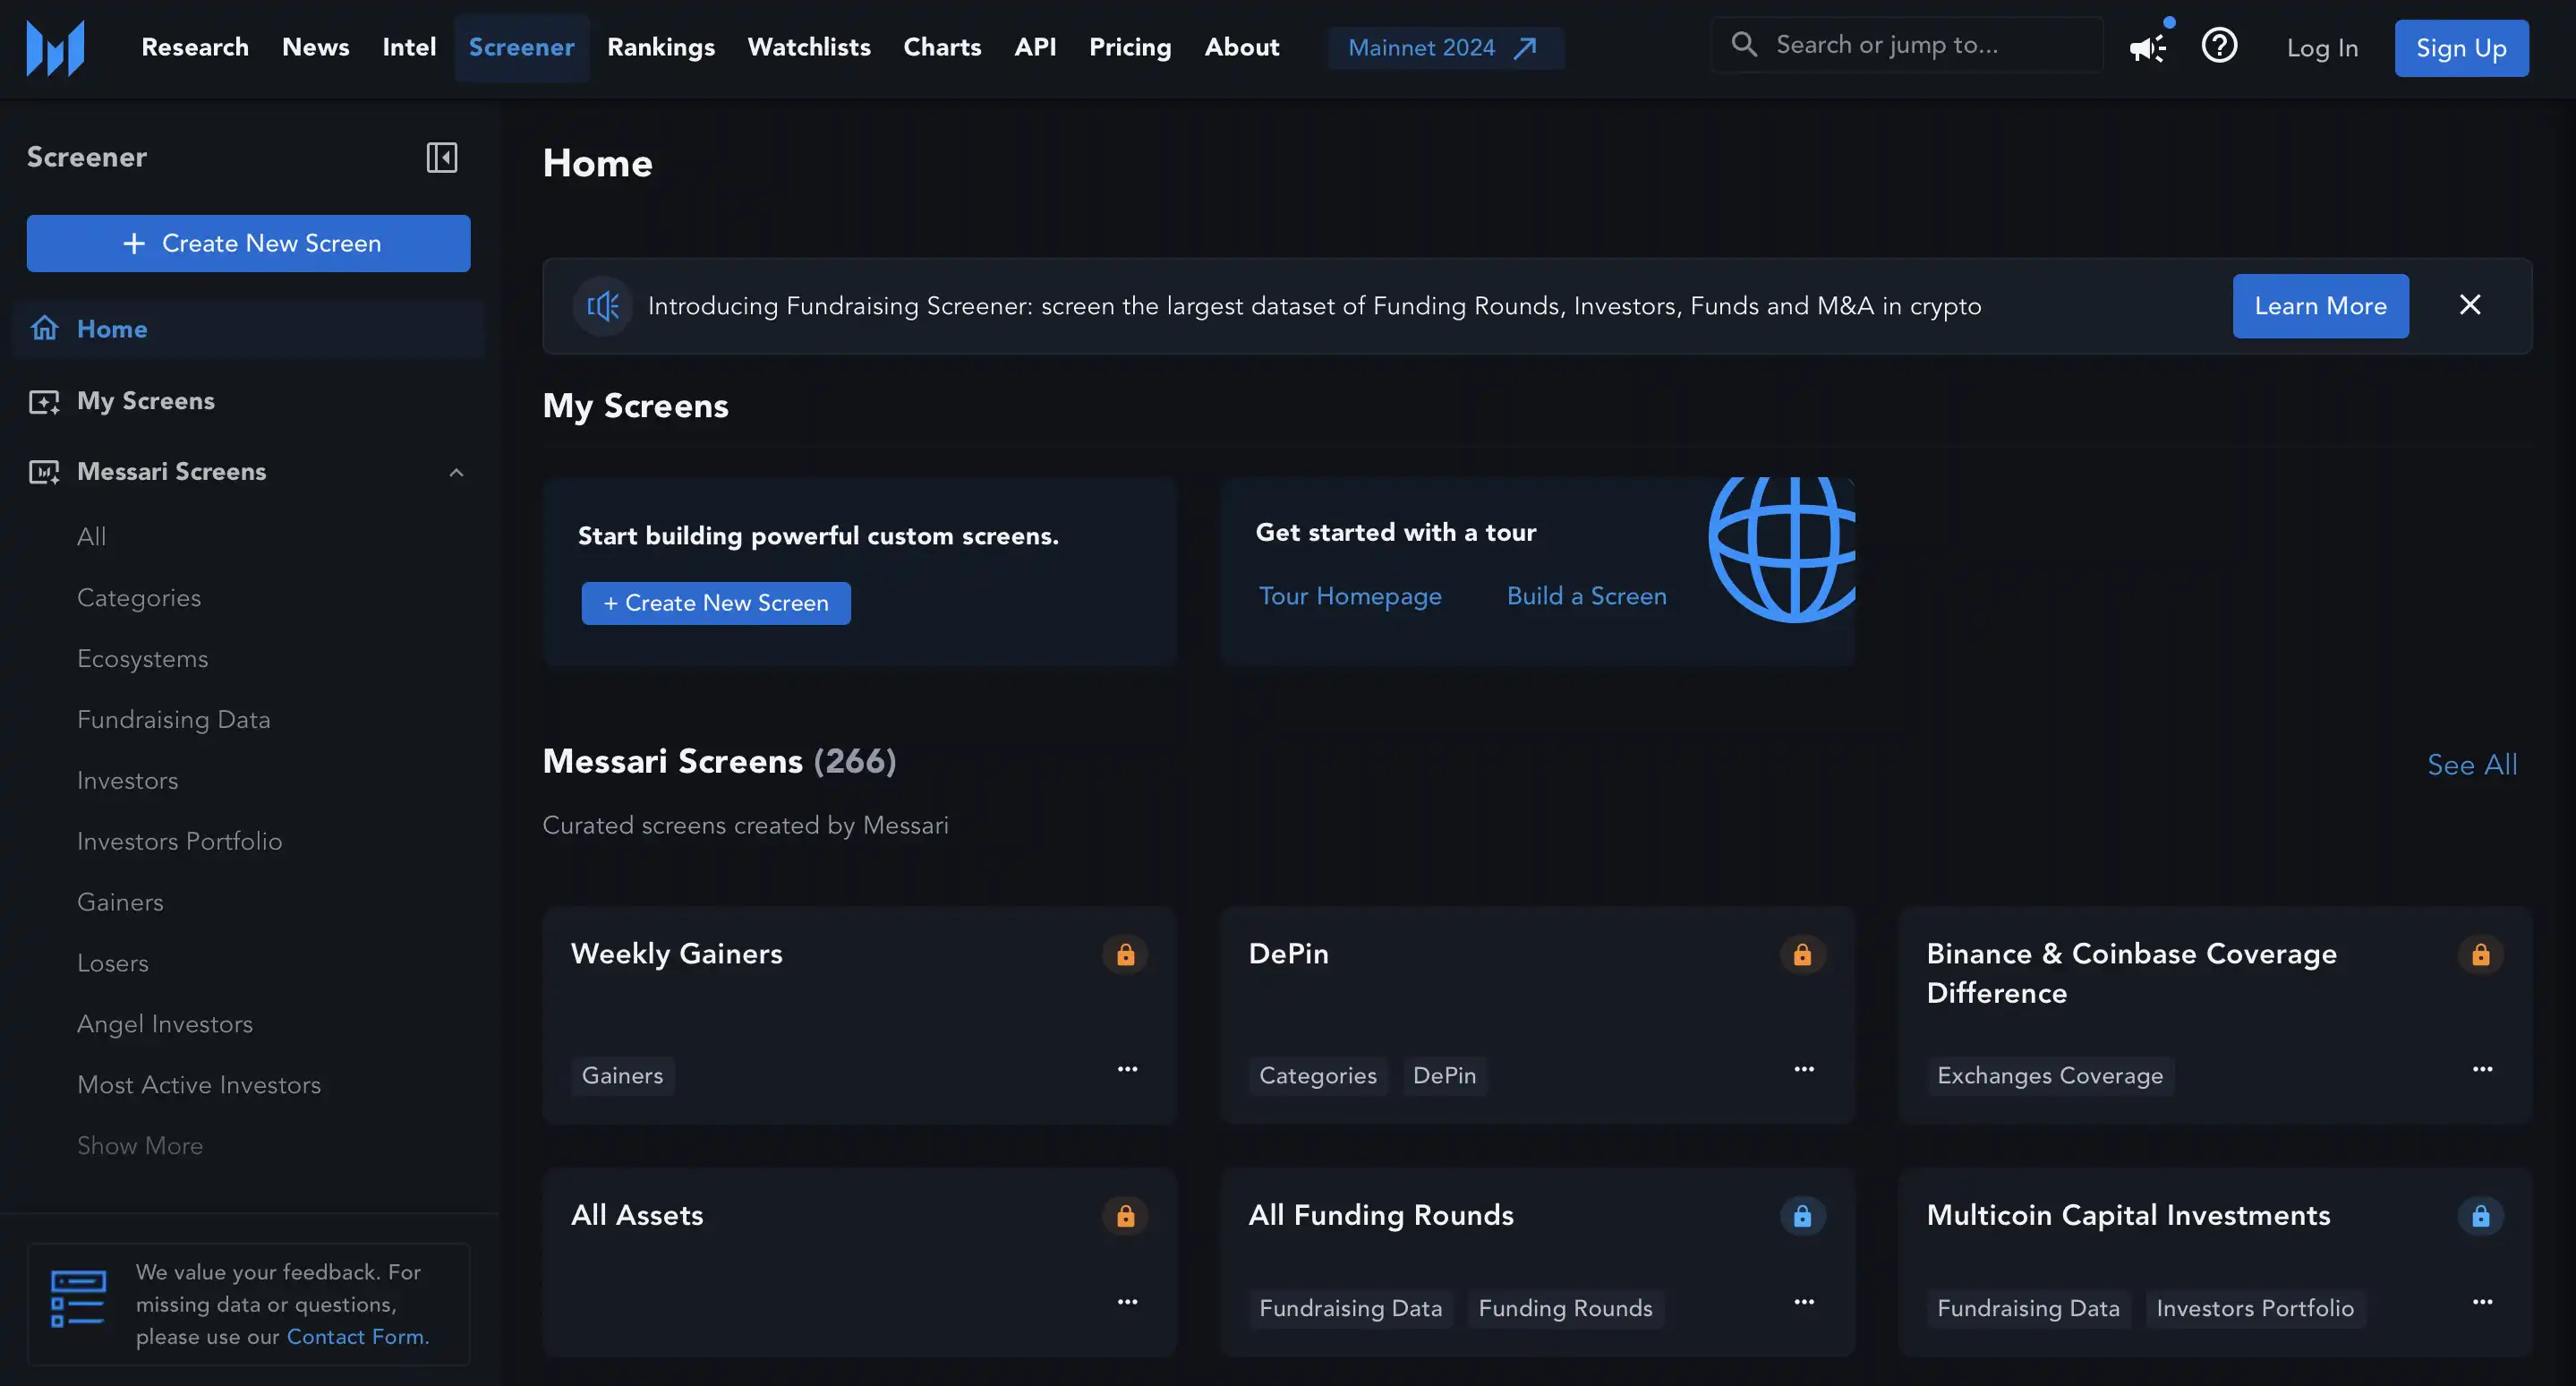
На главной странице Messari.io можно найти виджеты с различными рейтингами и событиями, графики и списки для наблюдения.
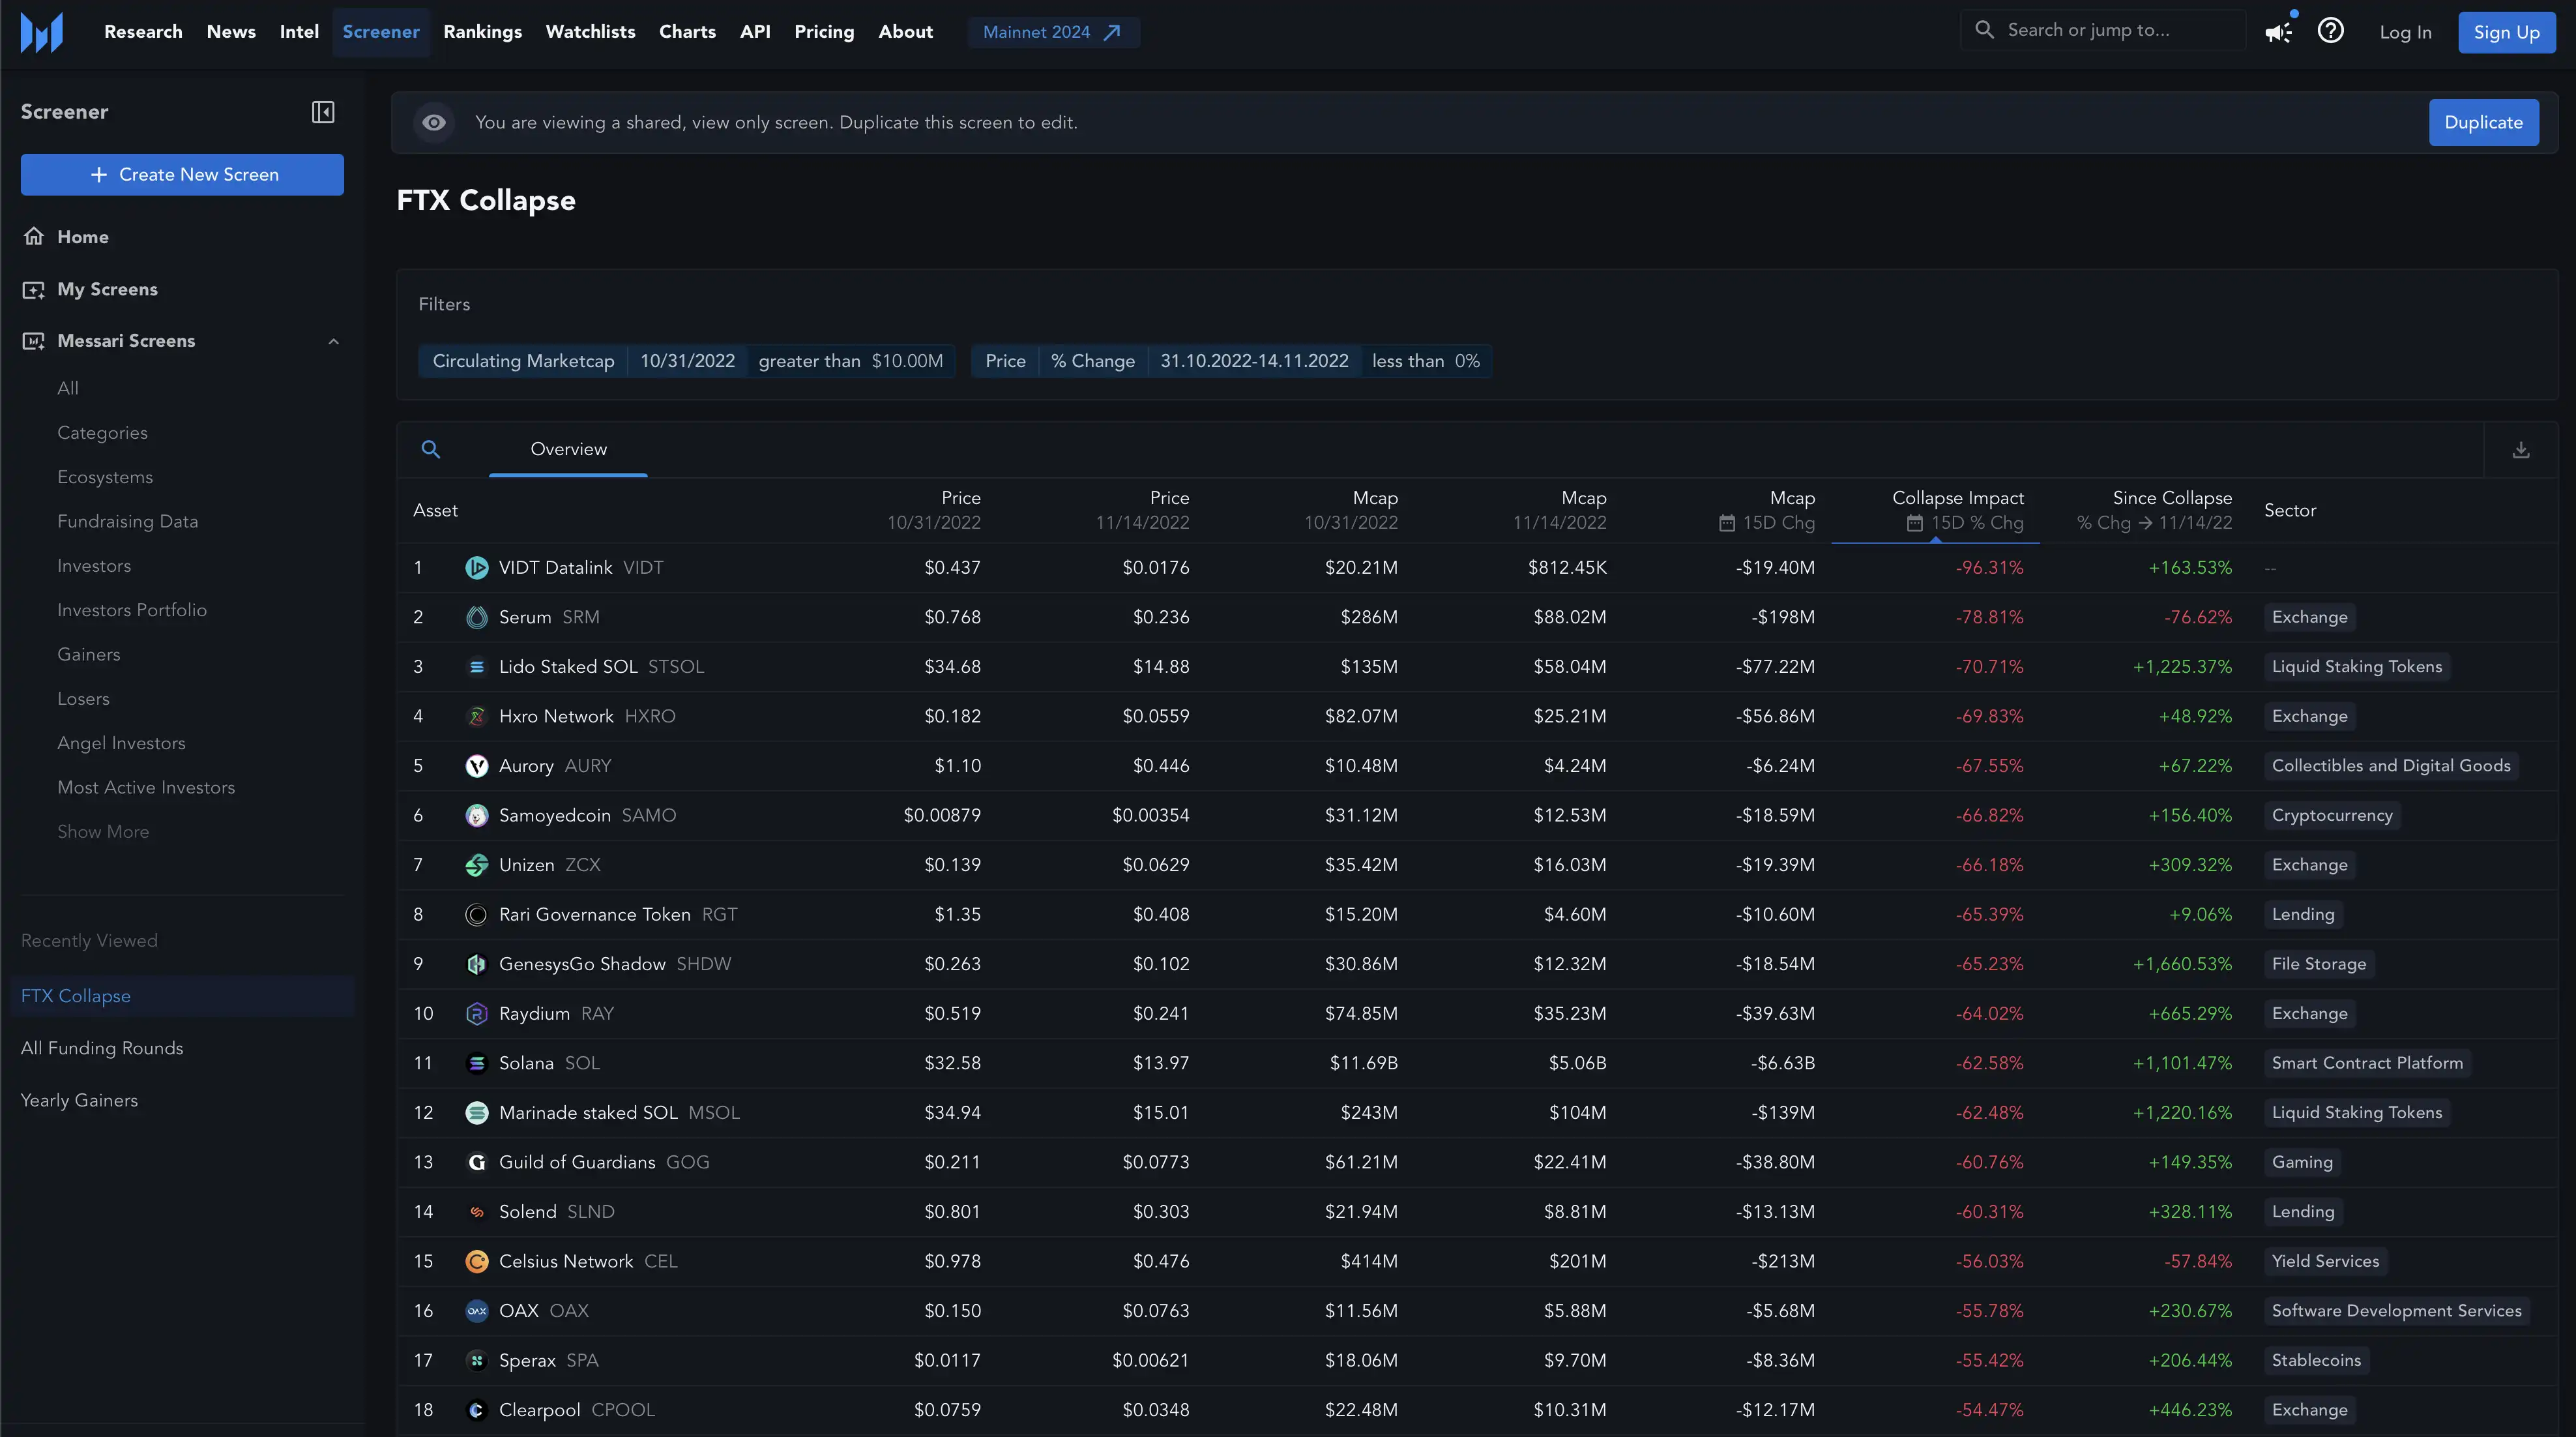
В разделе “Скринеры” Messari позволяет отслеживать состояние рынка, фильтруя информацию по различным параметрам, включая цену, процентное изменение за последний час или за 24 часа, рыночную капитализацию и другие. Также доступны функции кастомизации, экспорта данных, копирования настроек и возможности делиться информацией, правда большинство из них доступно только в рамках платной подписки.
Тут можно найти самые разнообразные скринеры, например, как изменились цены активов после коллапса FTX.
Еще одной интересной вкладкой на Messari являются “Графики”.
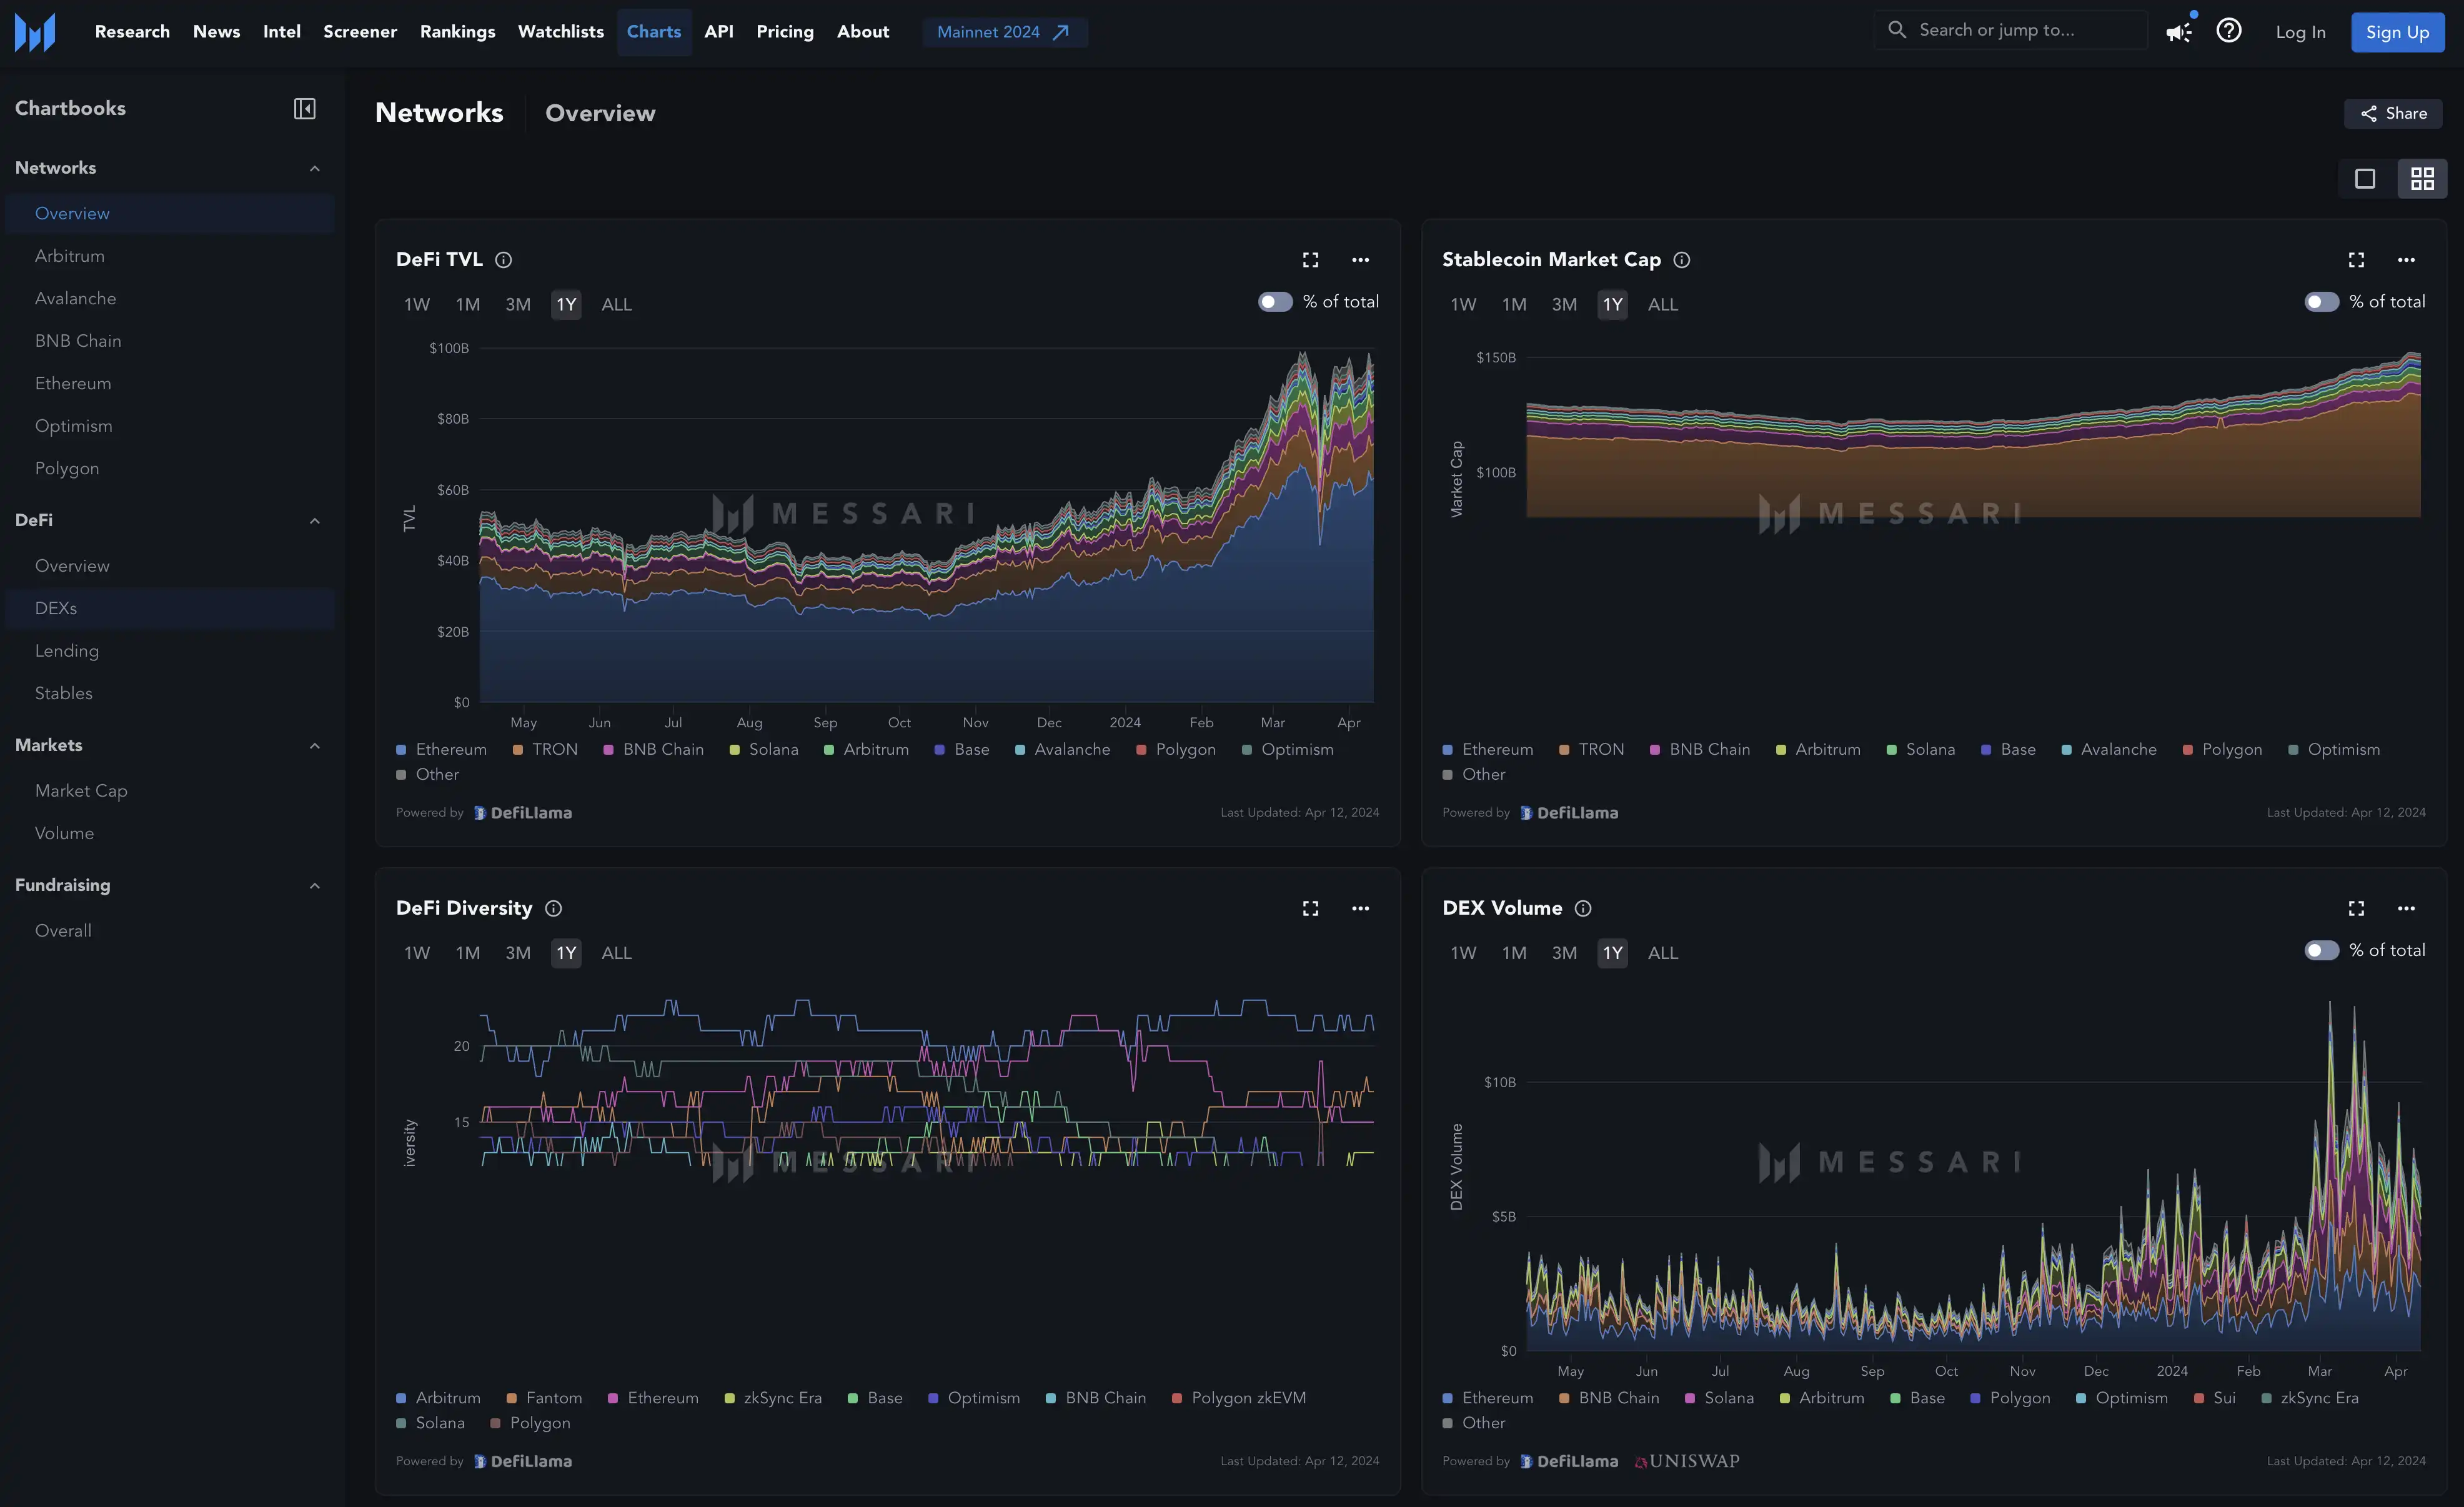
В этой вкладке можно отслеживать как целые секторы, например, DeFi, так и отдельно взятые сети и монеты в виде удобных метрик.
На платформе можно также найти информацию об отдельно взятой криптовалюте. Там мы найдем:
- Рыночные данные, такие как цена, объем торгов, рыночная капитализация и волатильность.
- Сведения о предложении, включая общие данные, выпуск валюты, токеномику и другое.
- Информацию о майнинге, включая хешрейт и сложность вычислений.
- Данные о кошельках.
- Активность на биржах.
- Комиссии и доходность в сети.
- Сетевую активность.
- Активность сообщества, связанную с данной криптовалютой.
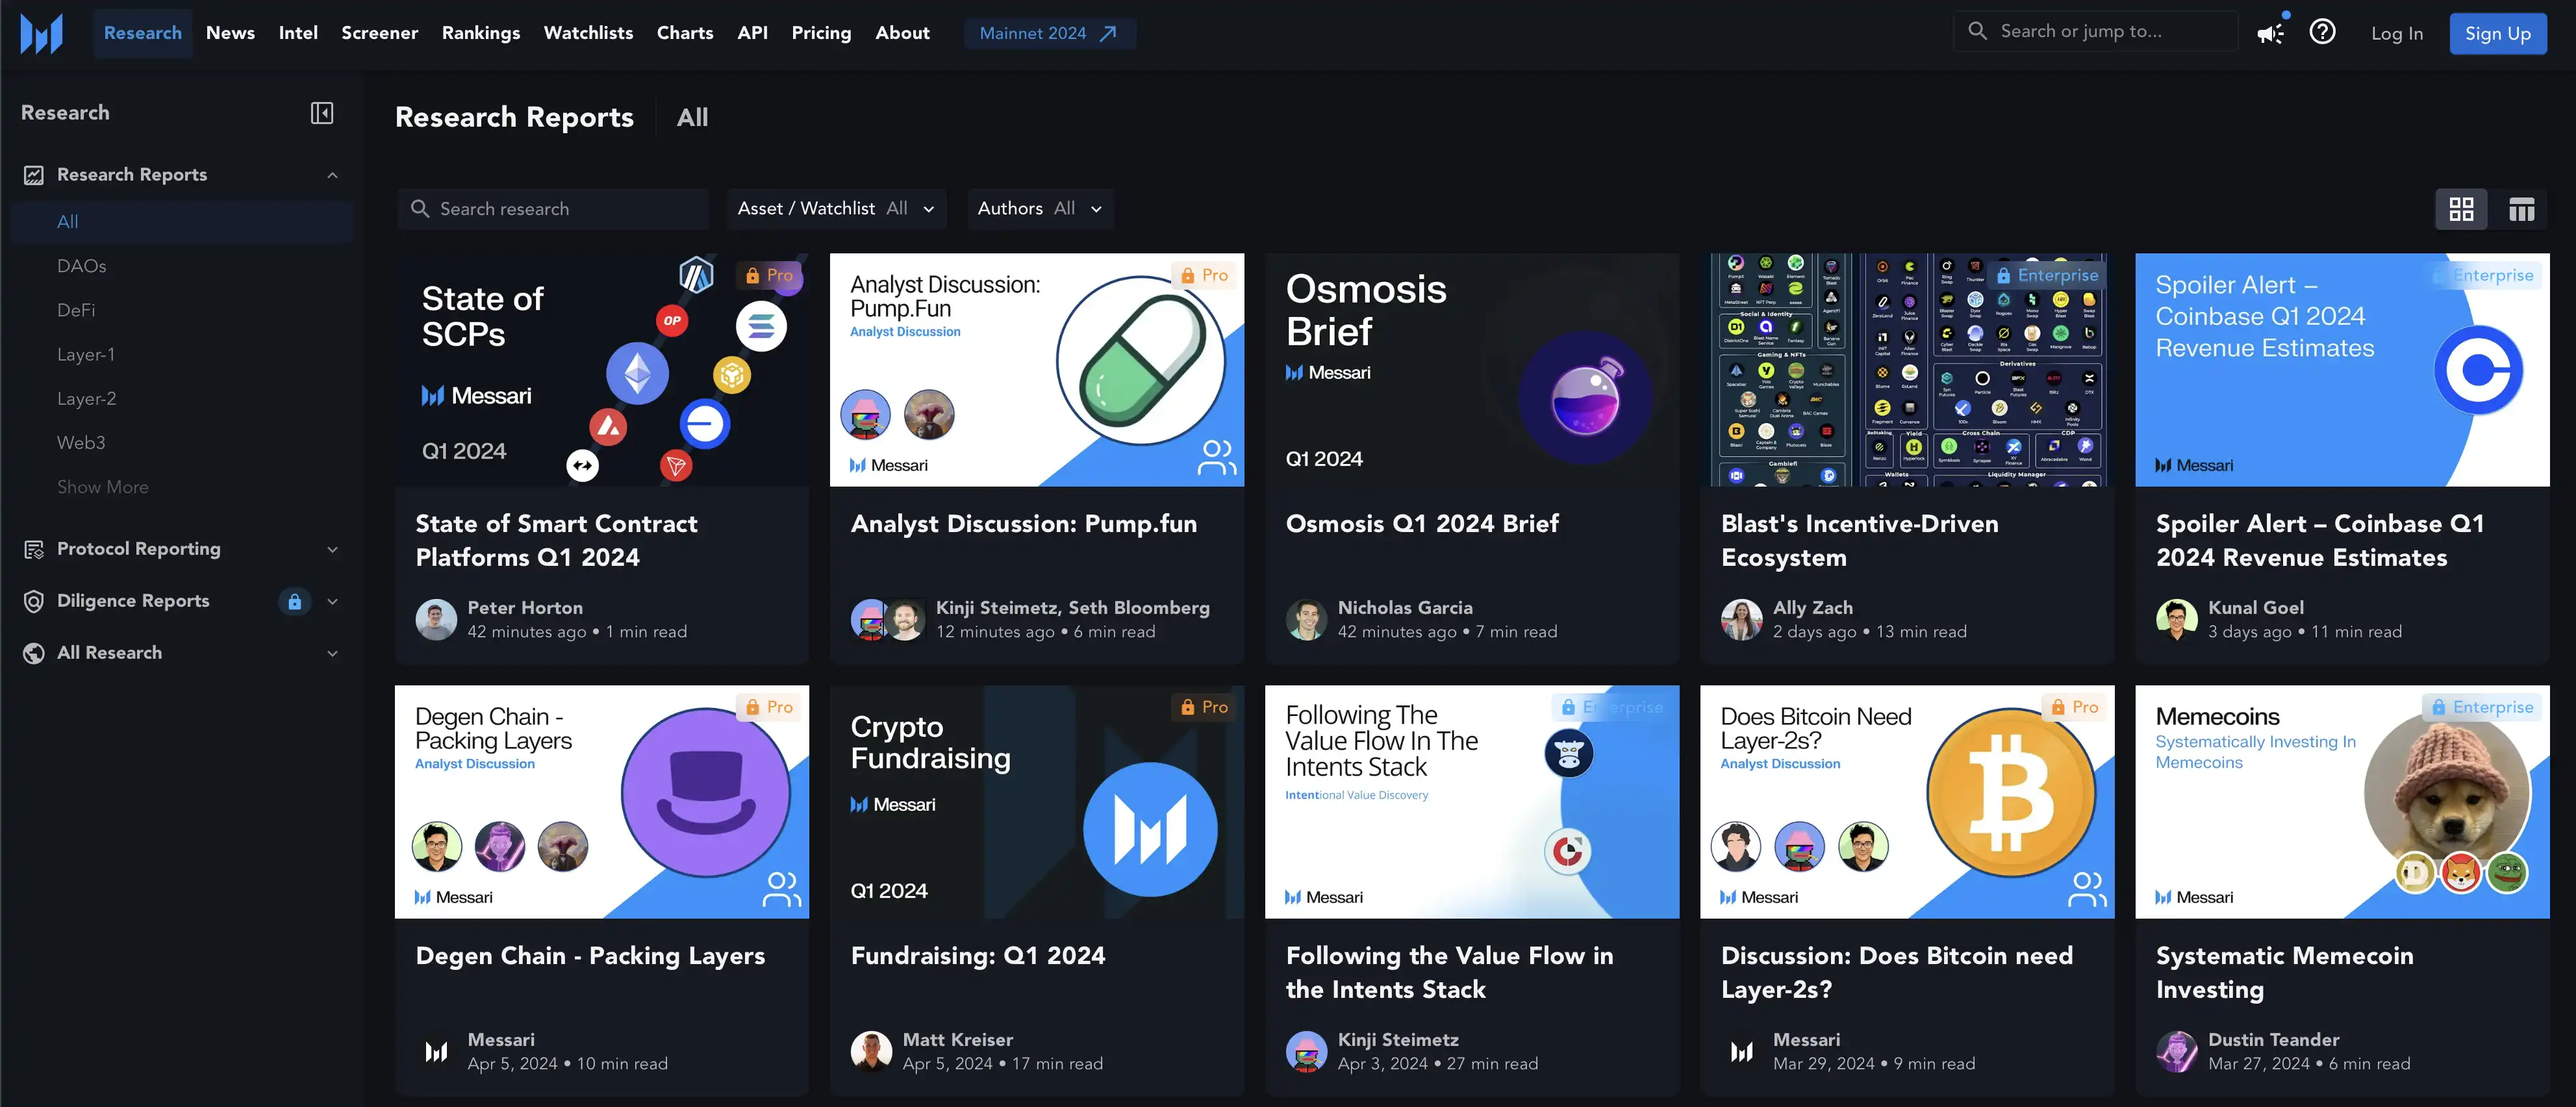
Раздел Research
Аналитическая команда Messari.io разрабатывает и публикует обширную базу статей, которая включает различные исследования и отчеты. Материалы в разделе Research охватывают темы, связанные с Web3, DeFi, инфраструктурой, макроэкономикой, а также различные аналитические обзоры.
Раздел Intel
В разделе Intel на Messari.io представлена эксклюзивная информация о предстоящих важных для рынка событиях: обновления, листинги, токенсейлы, NFT-дропы и прочее. Раздел включает календарь событий, где пользователи могут настраивать уведомления для удобства мониторинга. Однако, доступ к разделу Intel возможен только для подписчиков Messari Enterprise.
На платформе также есть вкладка “News” – крайне удобный новостной портал, поскольку на нем представлены последние новостные статьи из ведущих англоязычных криптовалютных медиа и официальные пресс-релизы проектов. Пользователи могут фильтровать новости по конкретным активам (или созданным спискам наблюдения) и различным категориям, однако для этого придется купить подписку.
Messari выделяется как один из ведущих агрегаторов информации на криптовалютном рынке, предлагая обширные аналитические инструменты для мониторинга и анализа. Пользователи сервиса могут детально изучать как отдельные криптовалюты, так и целые сегменты, а также следить за актуальными событиями и новостями. Исследования, проведенные командой аналитиков Messari, требуют отдельного внимания и приносят, как правило, много инсайтов, так что подписка очень легко может окупиться.
Arkham
Arkham – это платформа, которая позволяет пользователям проводить анализ транзакций в различных блокчейнах. На Arkham доступны статистические и исторические данные, инструменты для визуализации транзакций, а также детальный анализ активности отдельных кошельков. Платформа также оснащена удобными фильтрами и дашбордами, что упрощает структурирование и глубокий анализ данных согласно личным предпочтениям пользователя.
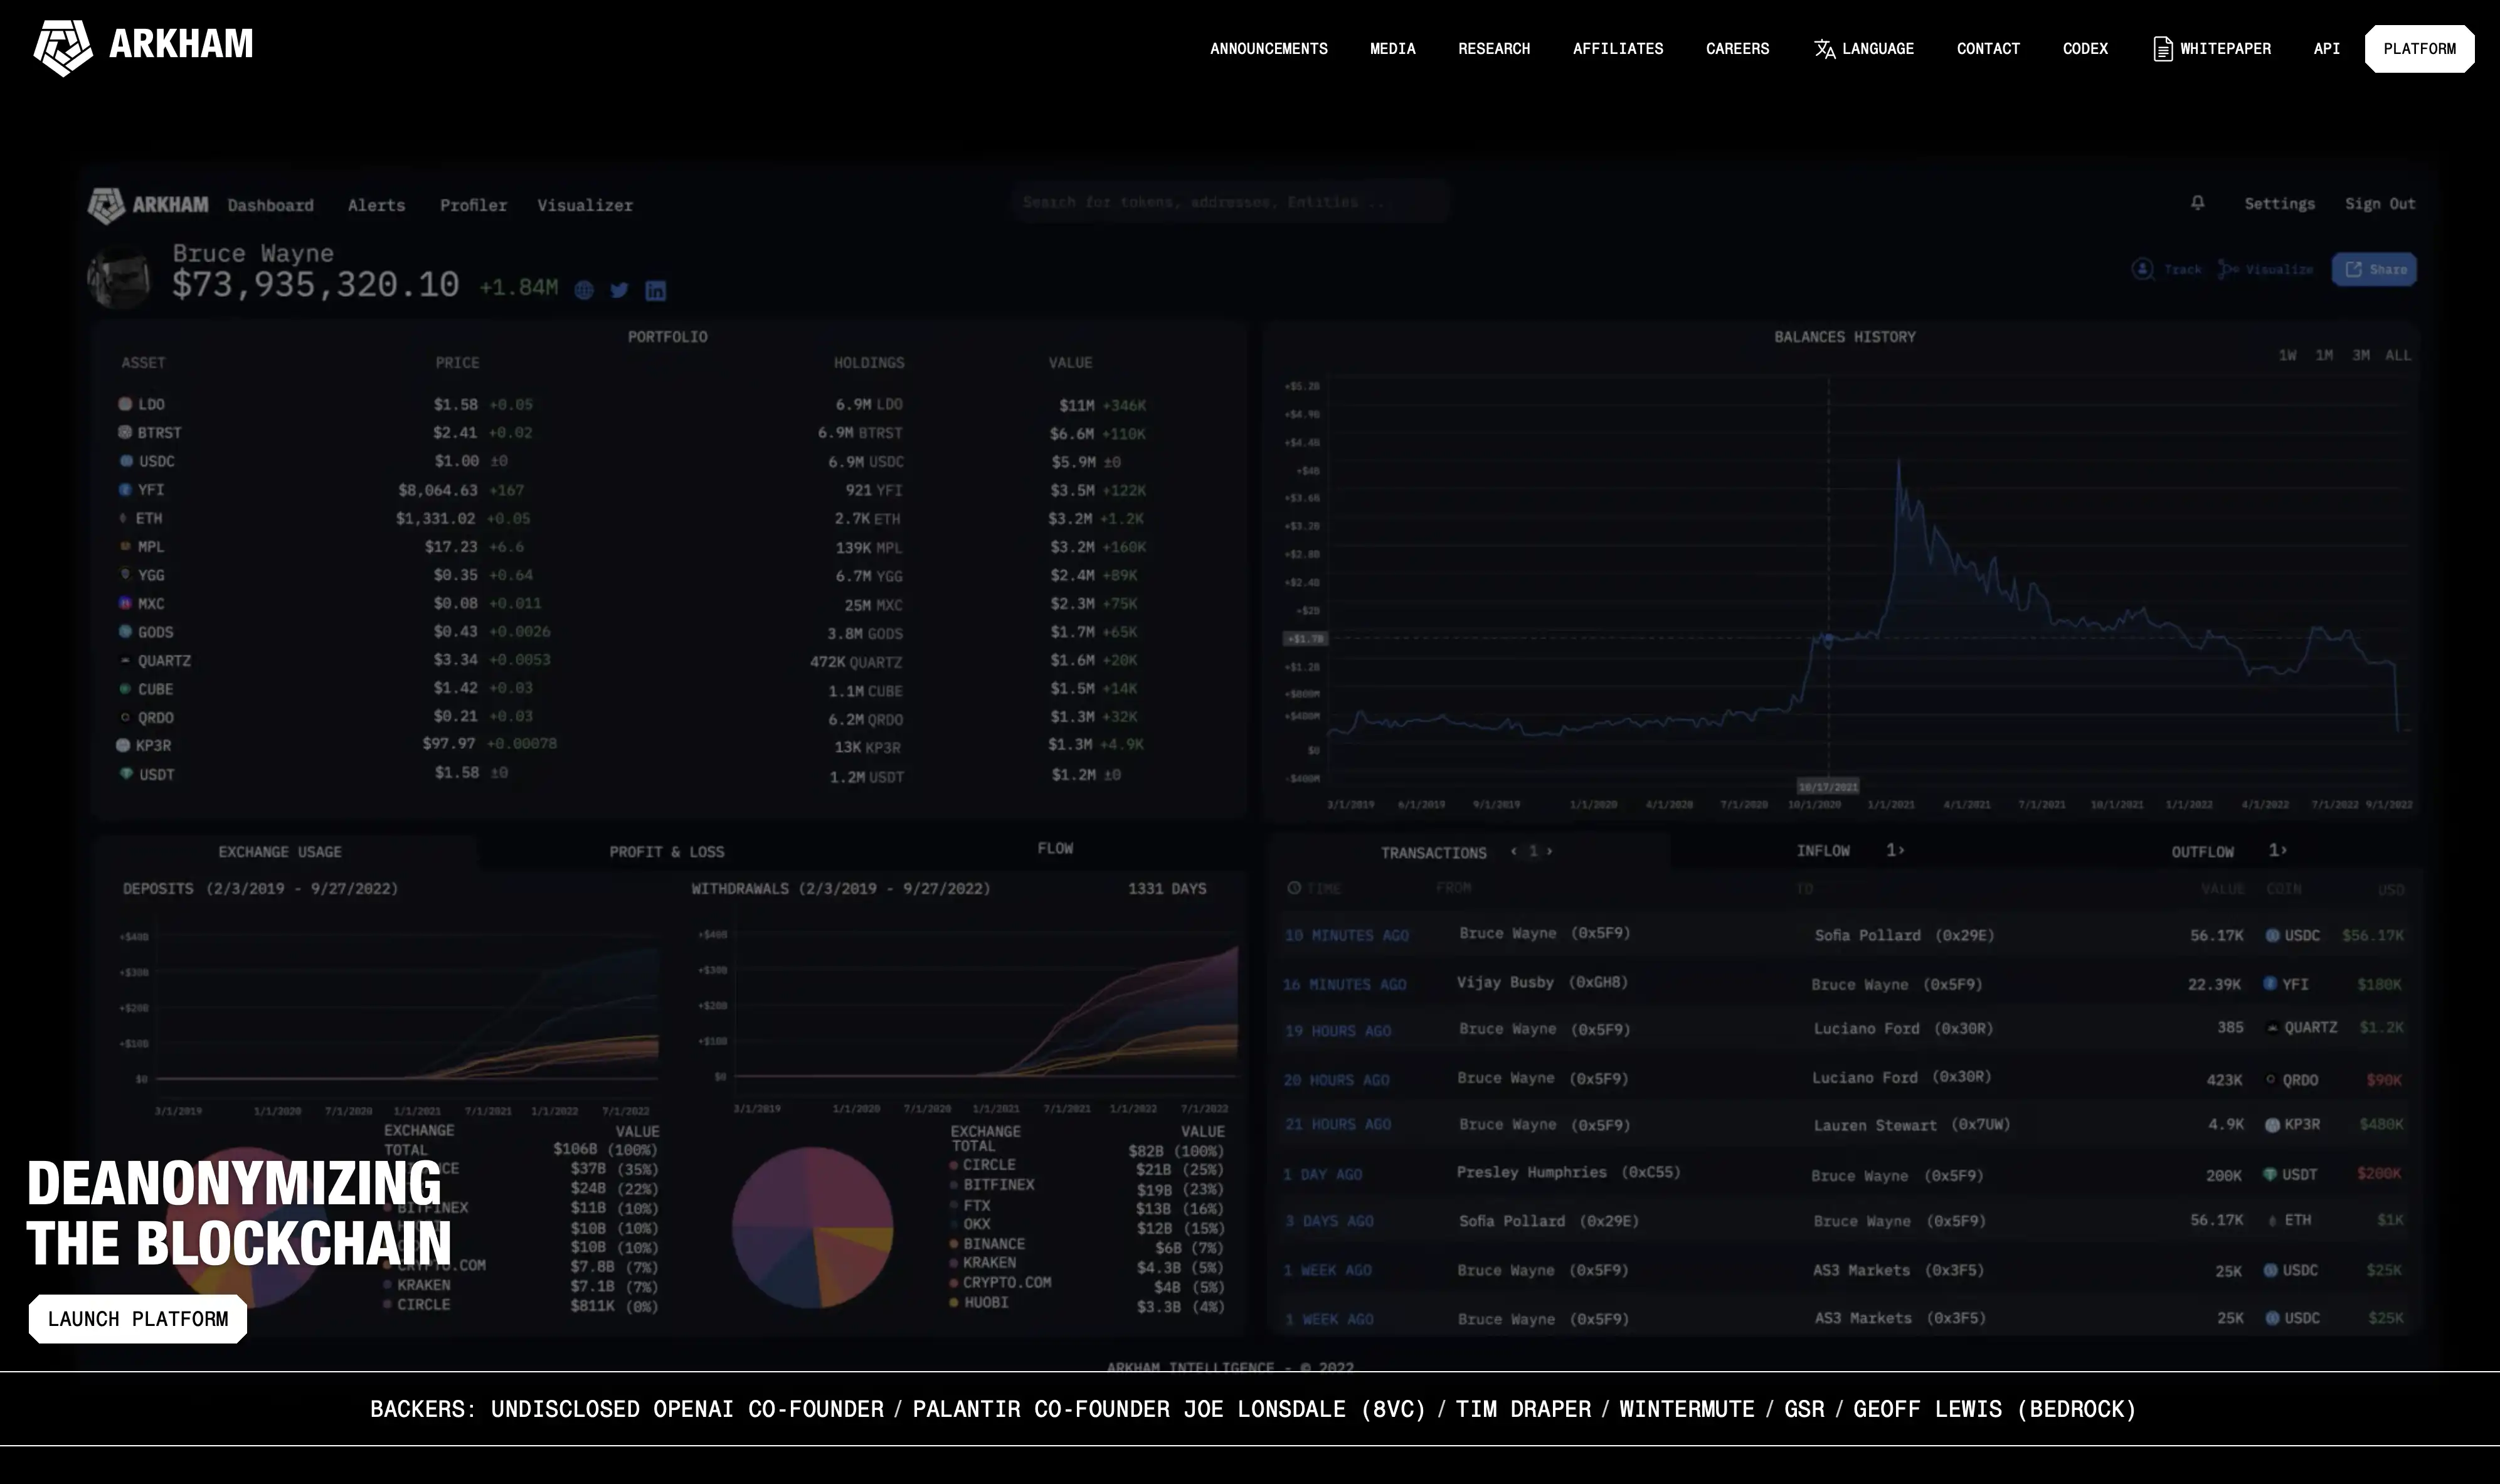
Arkham применяет искусственный интеллект для деанонимизации блокчейн-транзакций, выявляя реальных людей и компании за криптовалютными операциями. Платформа оснащена собственной разработкой – AI механизмом ULTRA, который алгоритмически связывает криптовалютные адреса с конкретными личностями или компаниями.
Кроме того, Arkham внедрила экономическую модель Intel-to-earn, которая способствует взаимодействию между покупателями и продавцами данных блокчейна на любом уровне.
Arkham состоит из двух ключевых элементов: аналитической платформы и Intel Exchange.
Аналитическая платформа предоставляет:
- Страницы индивидуальных лиц, компаний и организаций, где можно просматривать их текущие и прошлые портфели, а также детализированную историю транзакций, прибыли, убытков и ключевых партнеров, все это доступно для поиска и сортировки.
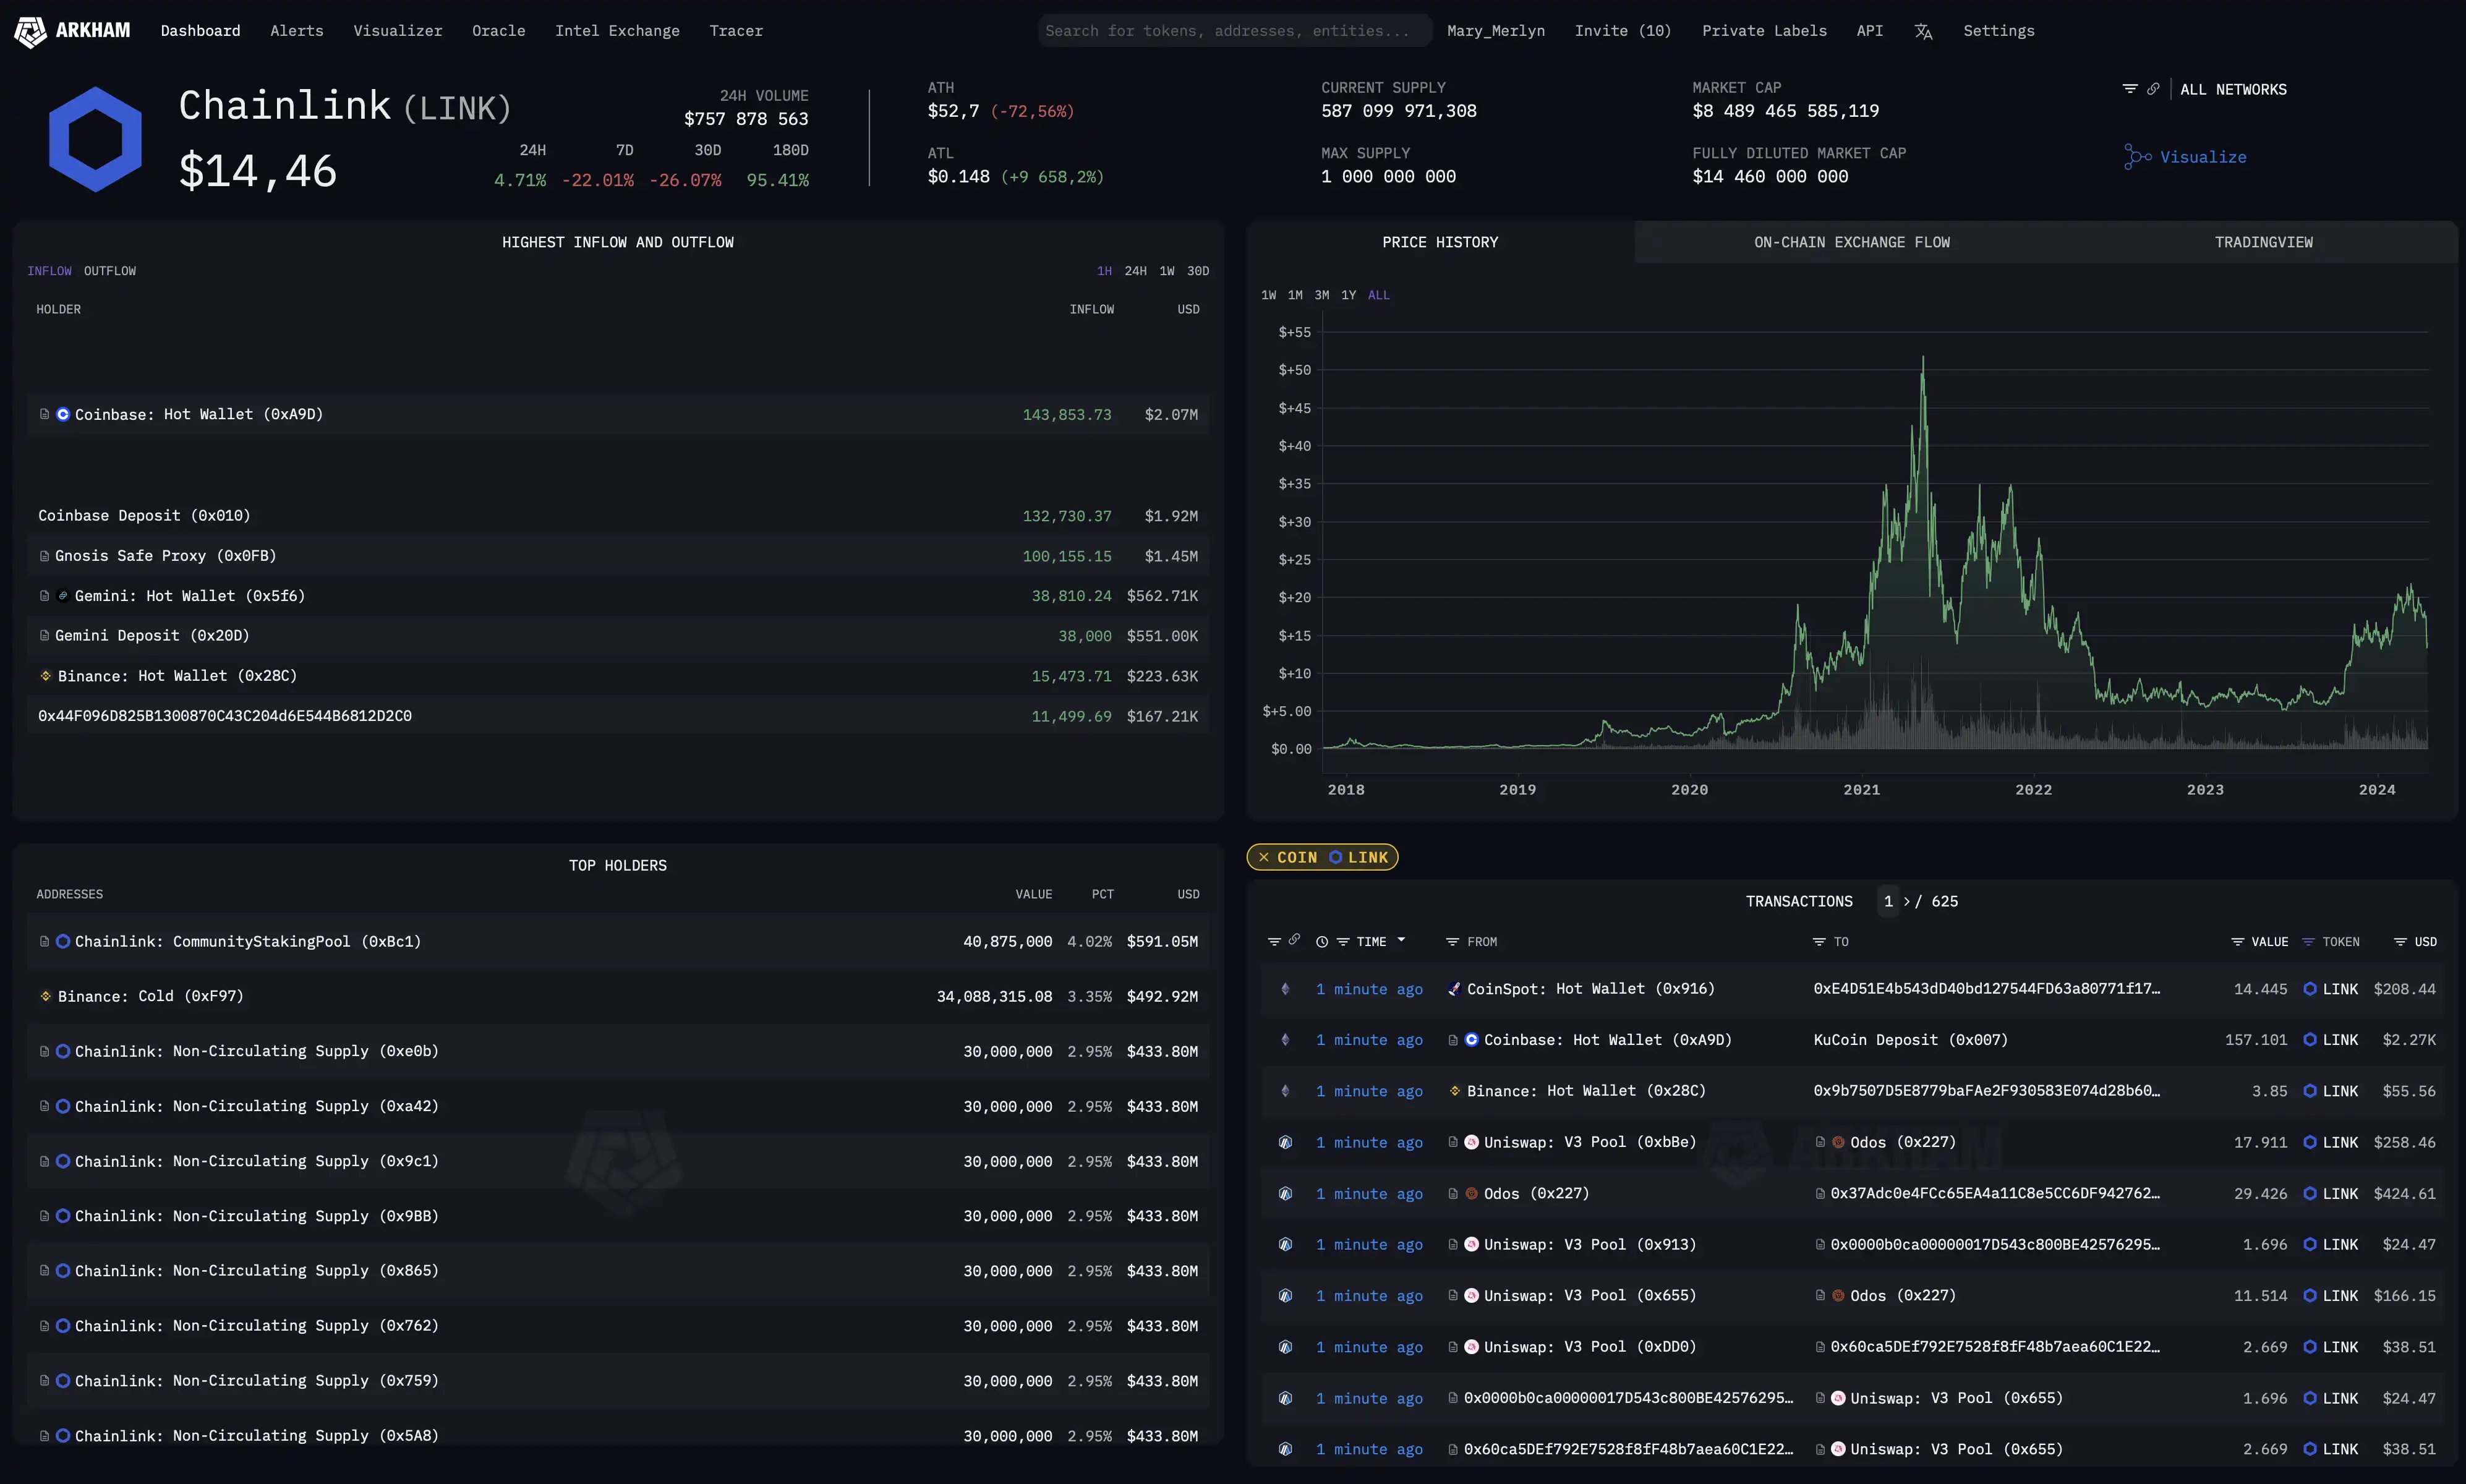
- Страницы токенов, демонстрирующие ведущих держателей, транзакции и потоки обмена.
- Визуализации сети, отображающие взаимосвязи между сущностями и движения средств.
- Мгновенные уведомления о транзакциях, соответствующие заданным критериям.
Arkham Intel Exchange предоставляет возможность всем желающим покупать и продавать контактные данные и другую информацию.
- Система вознаграждений: пользователи могут выставлять вознаграждения за нужные им сведения, блокируя средства в ARKM в рамках договора о вознаграждении. Охотники за информацией отправляют данные на проверку и, в случае утверждения, получают вознаграждение.
- Аукционы: пользователи, обладающие ценной информацией, могут продавать ее через аукцион тому, кто предложит наивысшую цену.
- Программа DATA: пользователи зарабатывают вознаграждения за предоставление данных, которые используются для тренировки Ultra, инструмента деанонимизации Arkham, основанного на искусственном интеллекте.
Экономика проекта
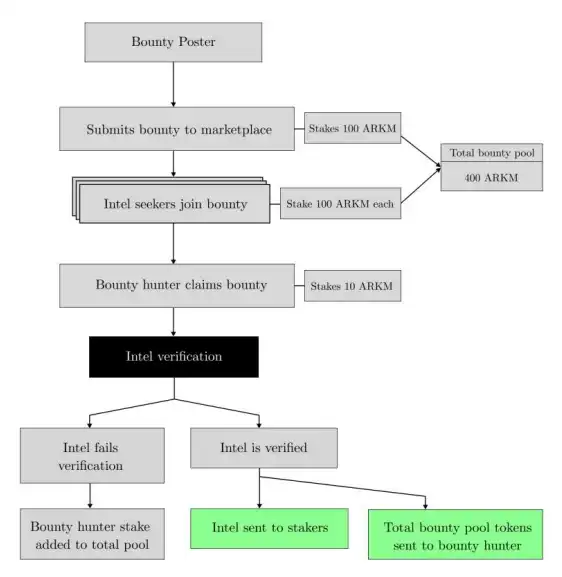
Покупатели, ищущие конкретную информацию, размещают награды в виде токена ARKM, являющиеся начальной наградой. После того, как первоначальная награда будет опубликована на Arkham Intel Exchange, любой может увеличить ее, поставив ту же сумму или больше ARKM, тем самым увеличив ценность награды и поощрения для охотников за головами.
Любой может побороться за награду, отправив заявку, которая затем проходит процесс проверки данных. Первая проверенная заявка получает вознаграждение.
Продавцы также могут устраивать аукционы для продажи своих разведданных. Если у продавца есть информация, которая по его мнению представляет ценность для рынка, он может отправить ее на проверку. После проверки информация выставляется на аукцион.
Для поддержки сети Arkham берет комиссию мейкера в размере 2,5% за поданные вознаграждения и выплаты на аукционах и комиссию в размере 5% за выплаты за вознаграждение и успешные аукционные ставки.
Создавая большие массивы структурированных аналитических данных и способствуя их распространению, Arkham делает крипторынки более прозрачными, эффективными и справедливыми.
Функционал Arkham
Внутри Arkharm существует: страница сущностей, визуализатор и страницы токенов.
Страницы сущностей предоставляют возможность просмотра текущих и прошлых активов портфеля, истории результативности, основных партнеров, активности на бирже и проведенных транзакций.
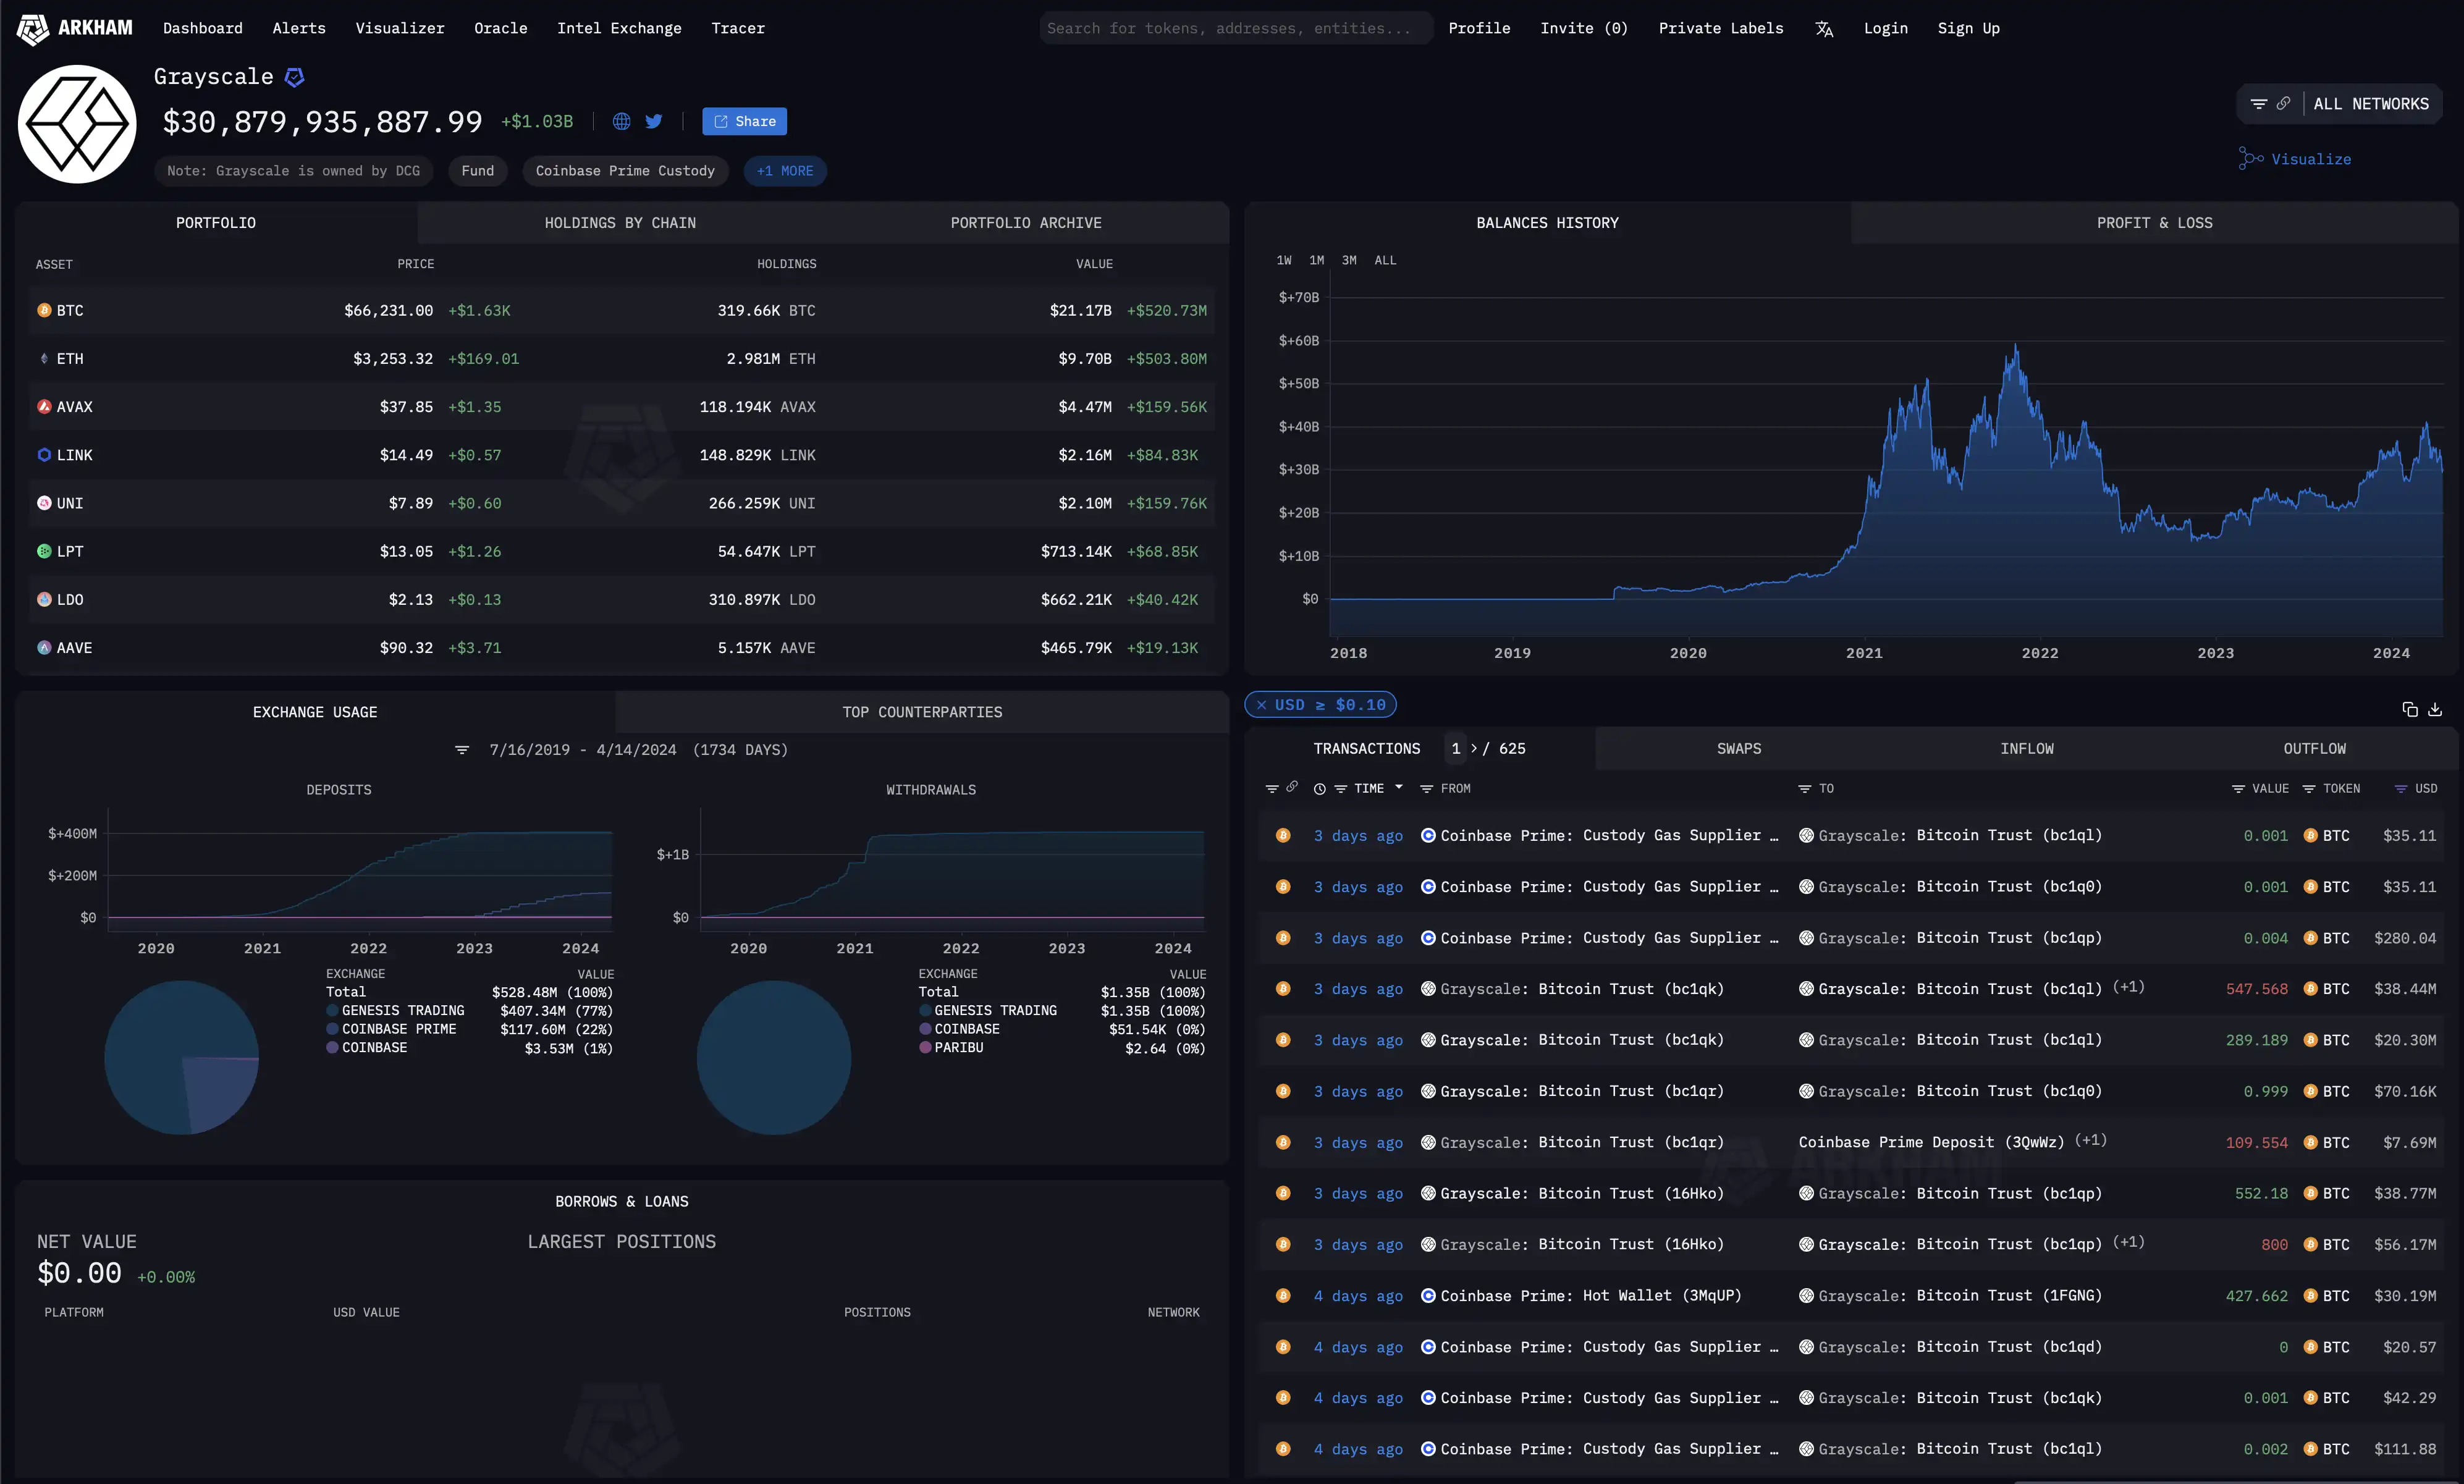
“Страница сущностей” – действия компании Grayscale
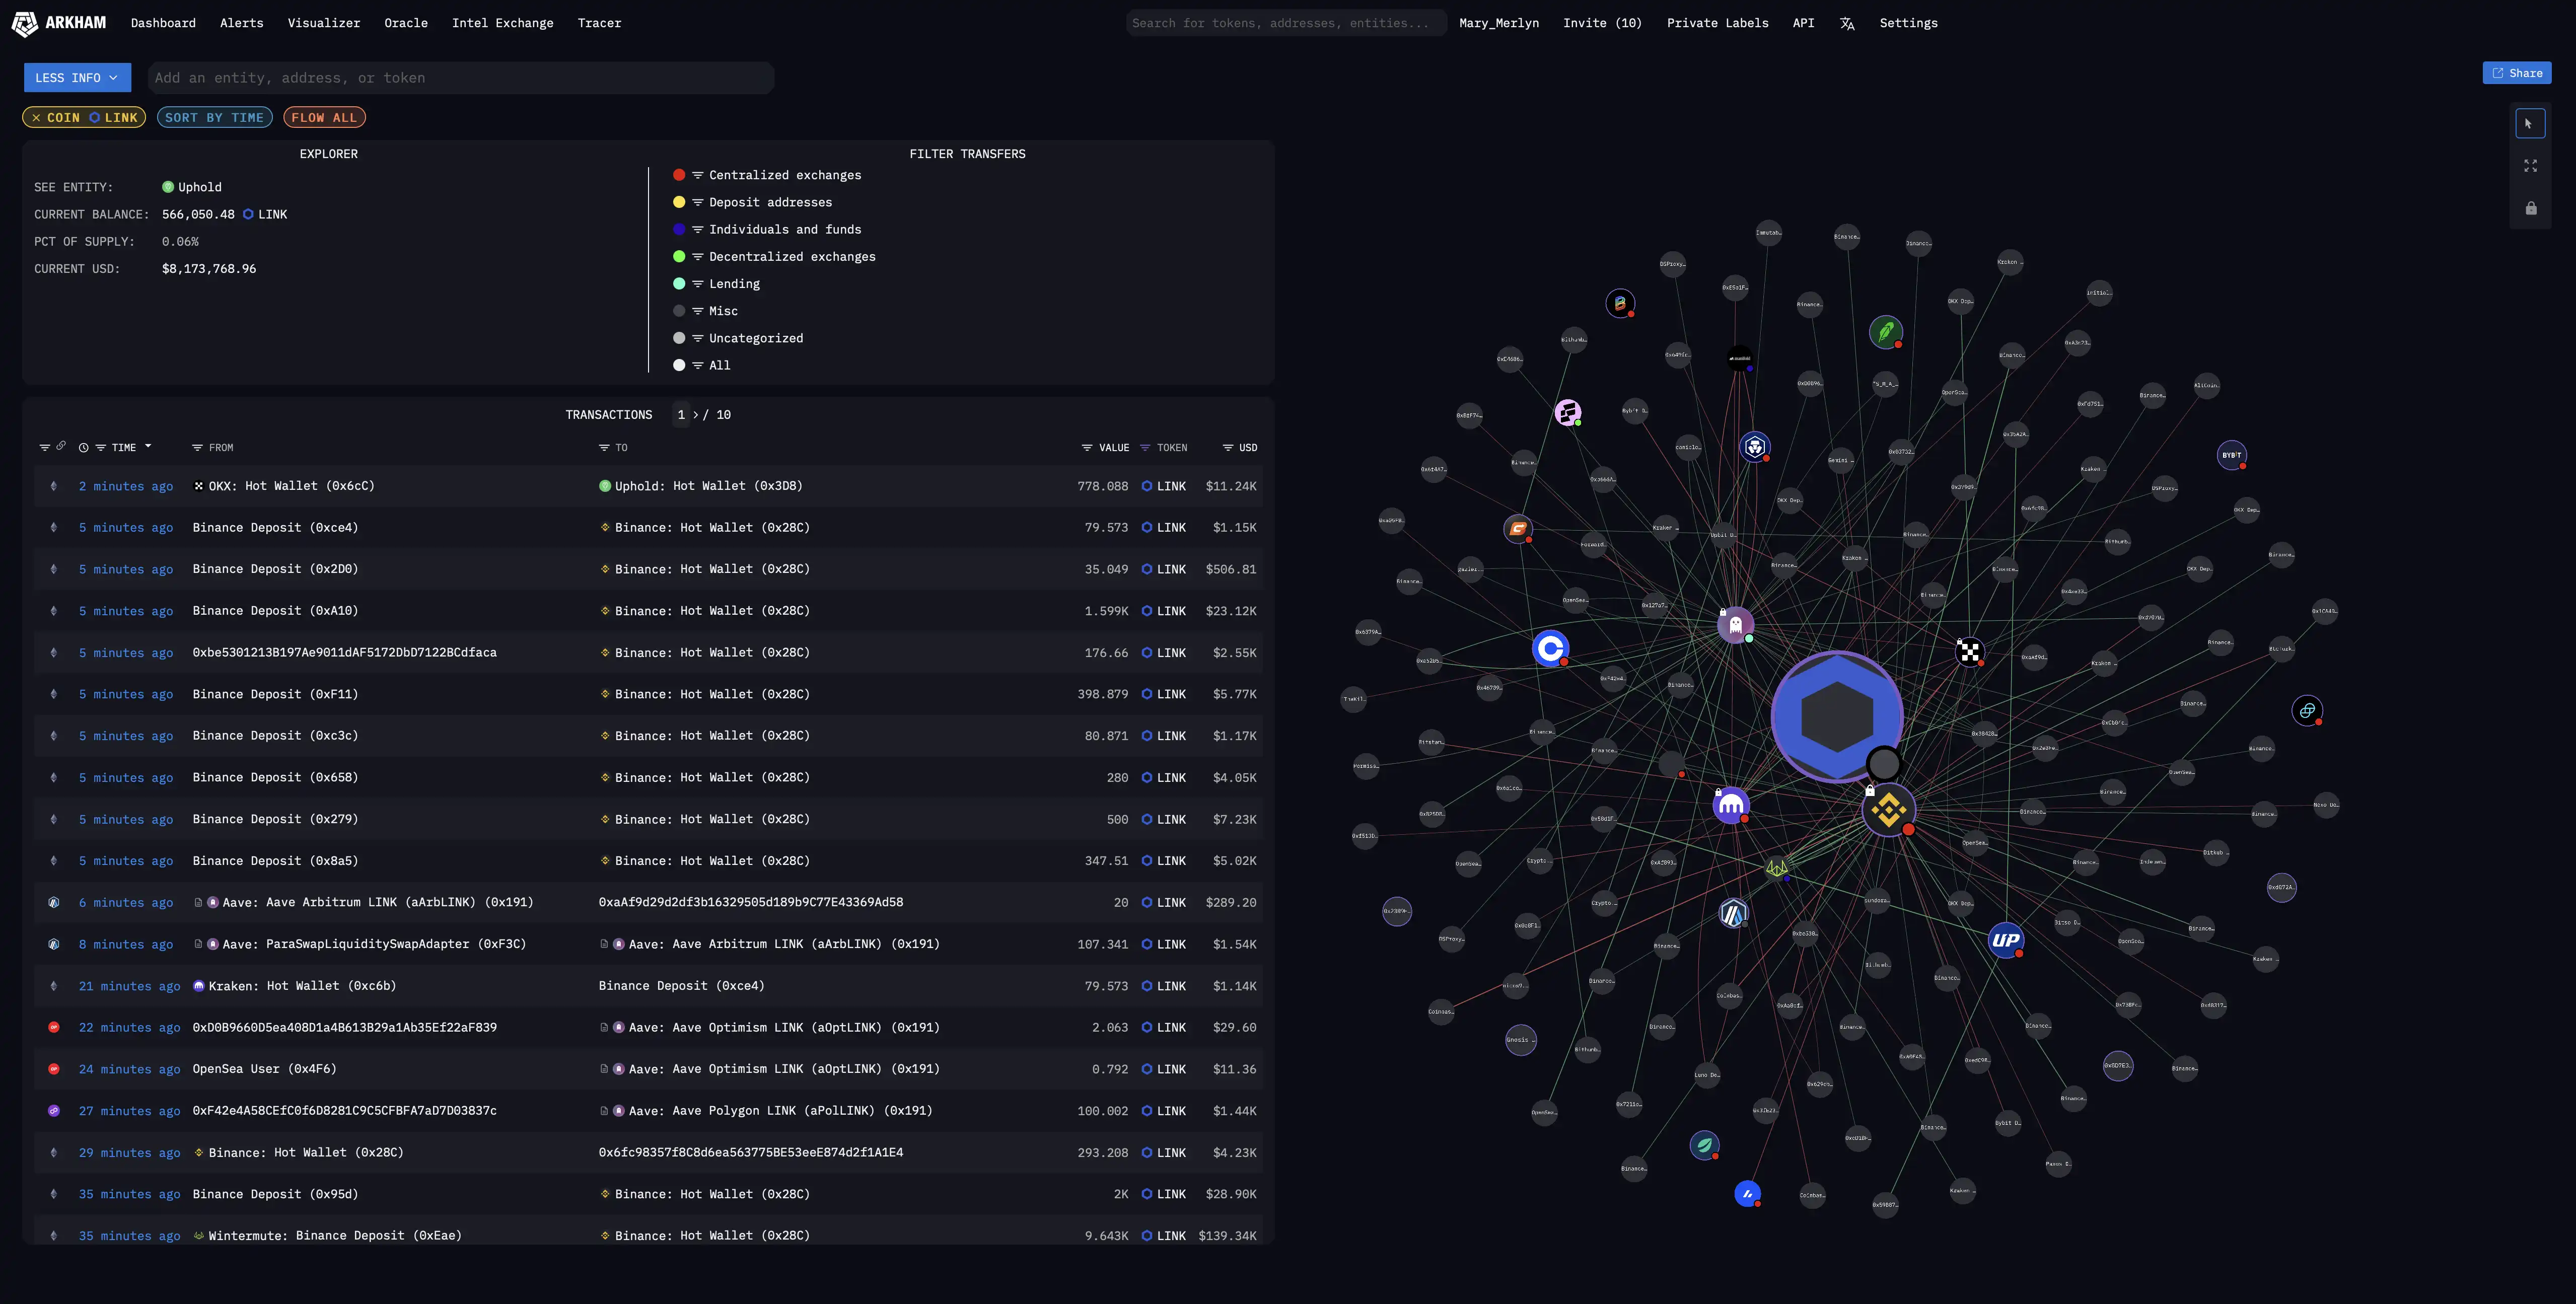
Визуализатор: преобразует деанонимизированные данные блокчейна в наглядные сетевые карты, помогая анализировать взаимосвязи и мониторить перемещение финансов.
Страницы токенов: предназначены для проведения своего собственного ресерча (DYOR). Они позволяют просматривать информацию о крупнейших держателях и потоках обмена. Также доступны функции сортировки и фильтрации транзакций.
Arkham удобный тем, что здесь каждый пользователь может создать себе собственный дашборд. Arkham предоставляет возможность создавать множество дашбордов, настраивая их с индивидуальным набором данных. Кроме того, в своем профиле вы можете добавить список аккаунтов, за которыми хотите следить и многое другое. И, конечно, на платформе доступна настройка уведомлений для удобства пользователей.
Юзеры платформы могут отслеживать активные кошельки: на Arkham можно идентифицировать ранних инвесторов в популярные токены или кошельки с высокой доходностью, а также мониторить их последующие операции – а эту информацию можно неплохо использовать для инвестиционной деятельности.
Кроме того, с Arkham, пользователи могут мониторить большие транзакции: сервис предоставляет возможность настроить уведомления о крупных транзакциях для выбранных токенов и кошельков, следуя движениям средств ключевых участников рынка.
Можно отслеживать и торговые данные в реальном времени: Arkham предоставляет информацию о ценах активов в поддерживаемых сетях, объемах торгов и транзакциях в реальном времени, что является ценным ресурсом для трейдеров.
Также можно визуализировать связь между кошельками: визуализатор преобразует сложные транзакционные данные в понятные и читаемые диаграммы, показывая перемещения средств между участниками.
Arkham – платформа, которая открывает множество возможностей перед криптанами. По сути, эта платформа дает возможность пользователю проводить ончейн-анализ, данные после которого можно использовать для торговли или инвестирования.
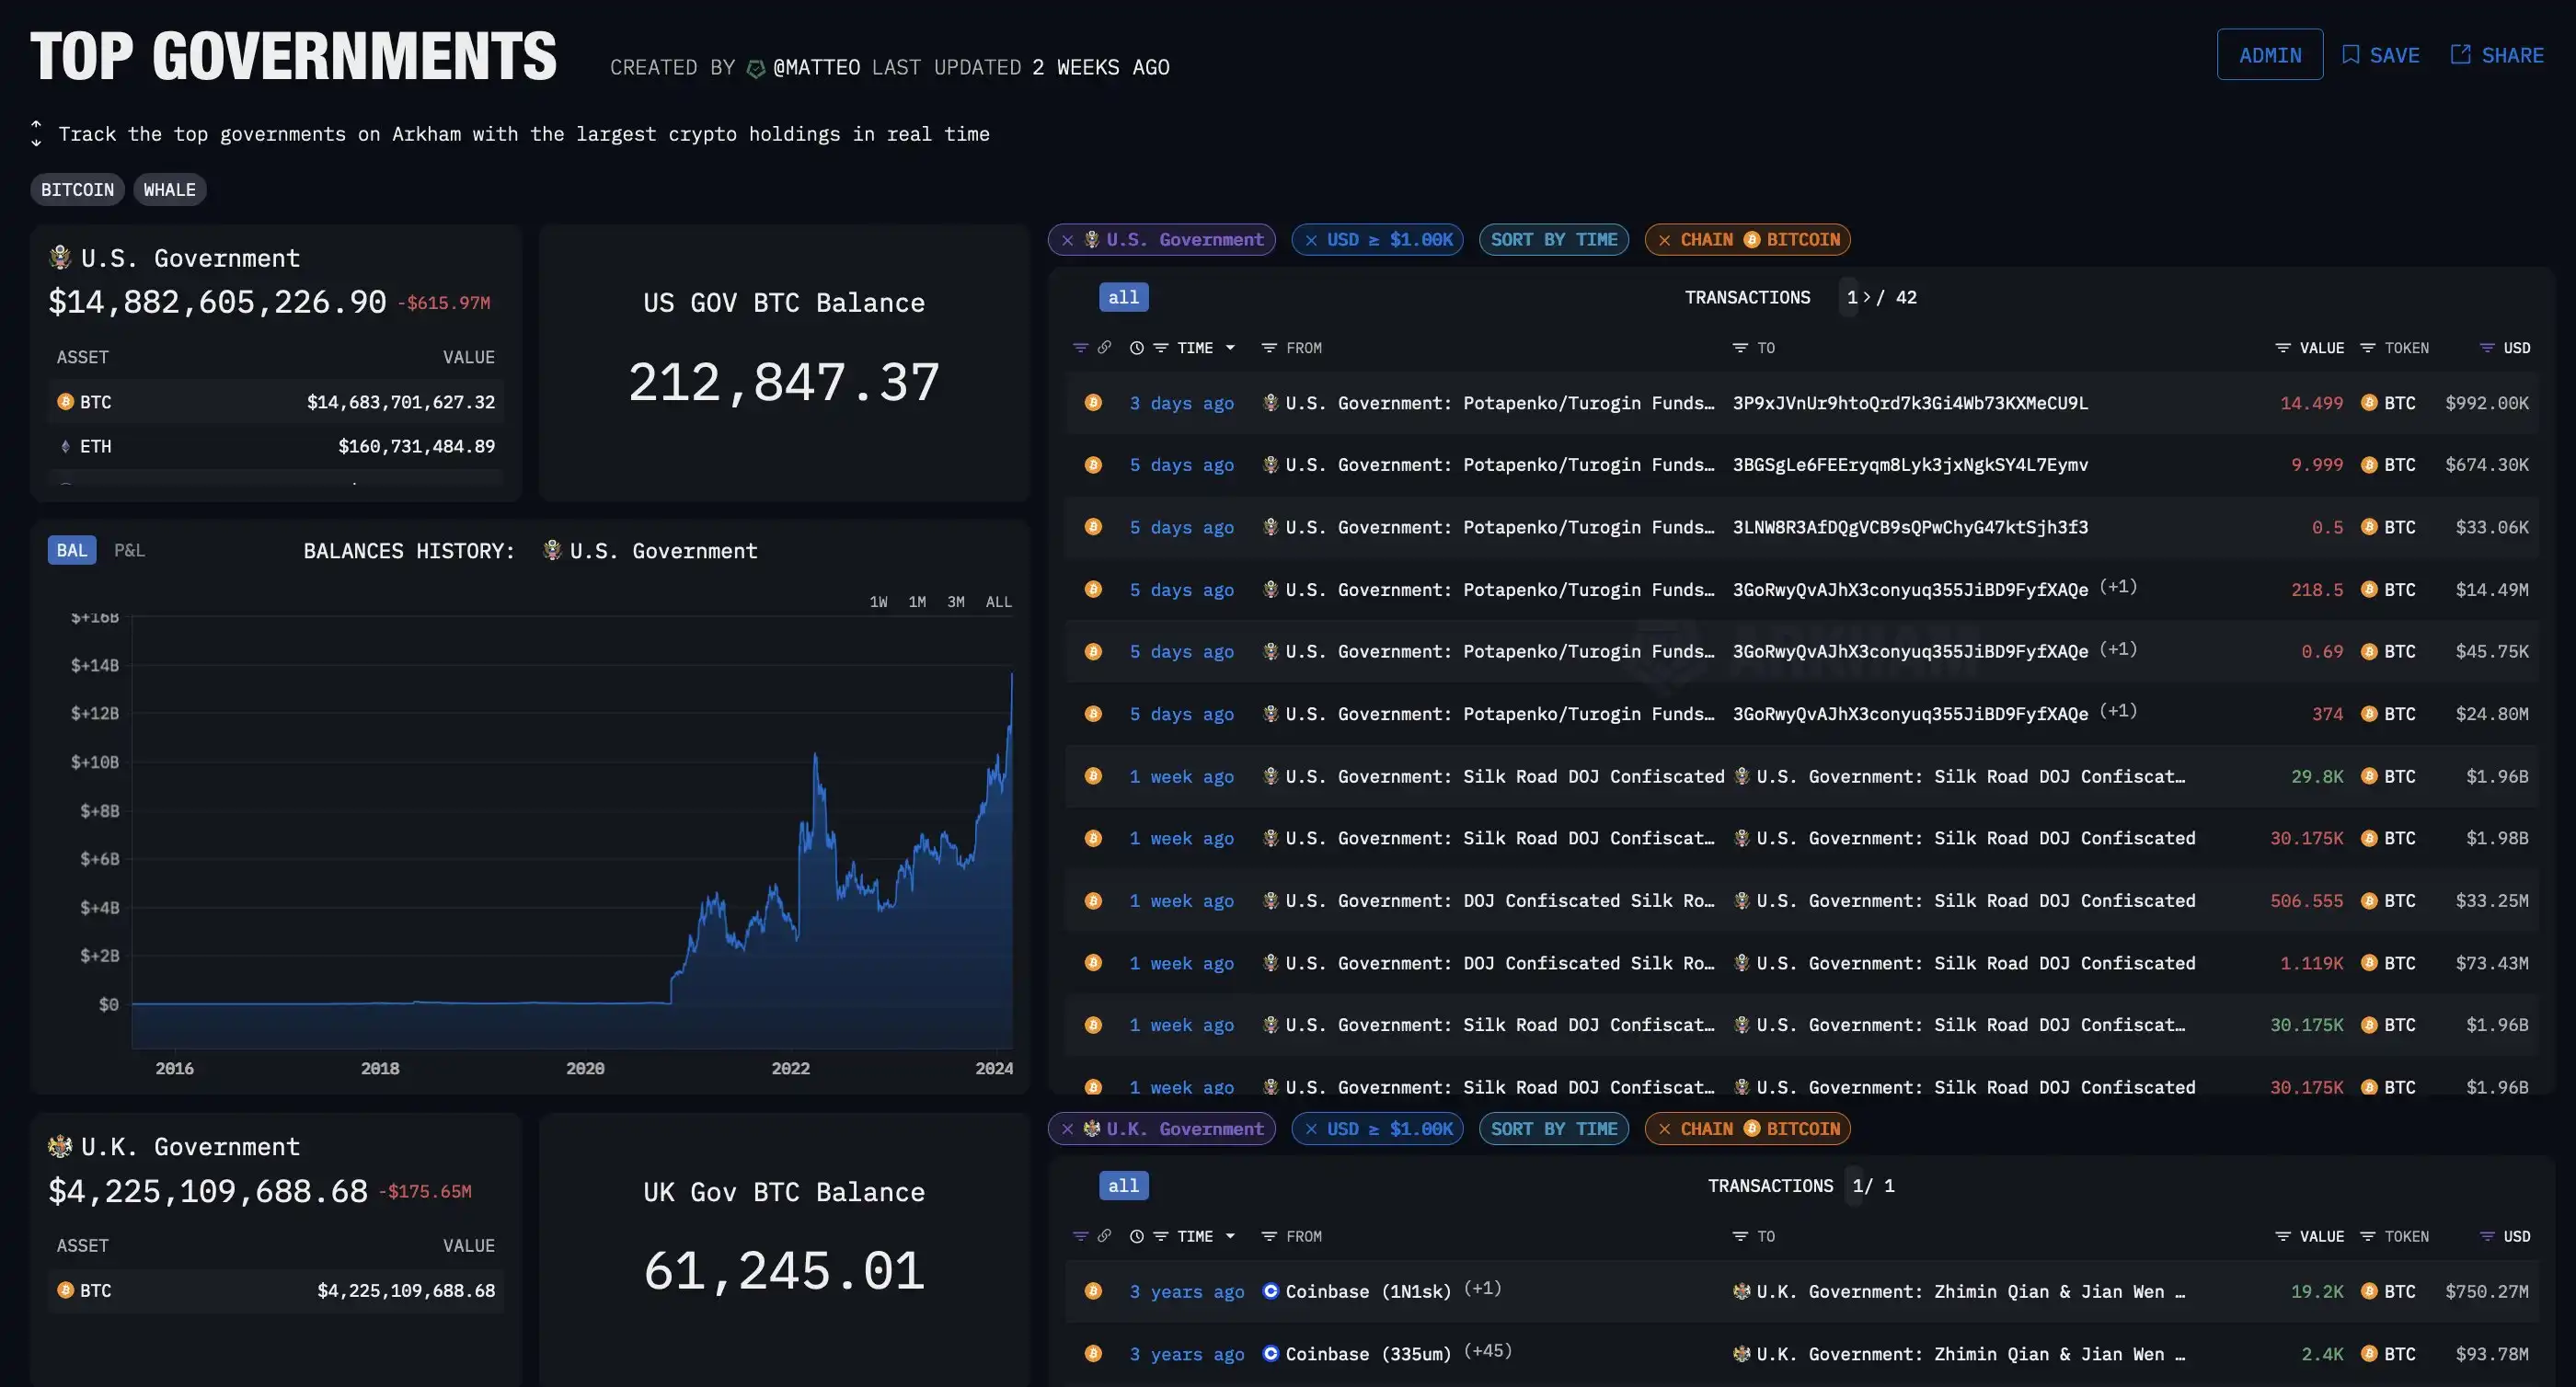
Интересной метрикой, созданной Arkham, является дашборд, который показывает, сколько BTC на счету у разных правительств. Больше всего BTC у США – почти 15 миллиардов долларов США.
Лайфхак: по транзакциям в этом дашборде можно удобно посмотреть, когда правительству захочется проманипулировать рынком.
Hyblock Capital
Hyblock Capital представляет собой платформу, нацеленную на предоставление инструментов и ресурсов для анализа и управления инвестициями. Эта платформа обладает широким спектром функциональных возможностей, включая отслеживание портфолио, анализ рыночных данных, мониторинг уровней ликвидаций, а также предлагает скринер криптовалют и множество других инструментов. Некоторые базовые функции доступны бесплатно, однако за доступ к более расширенным функциям потребуется оплата.
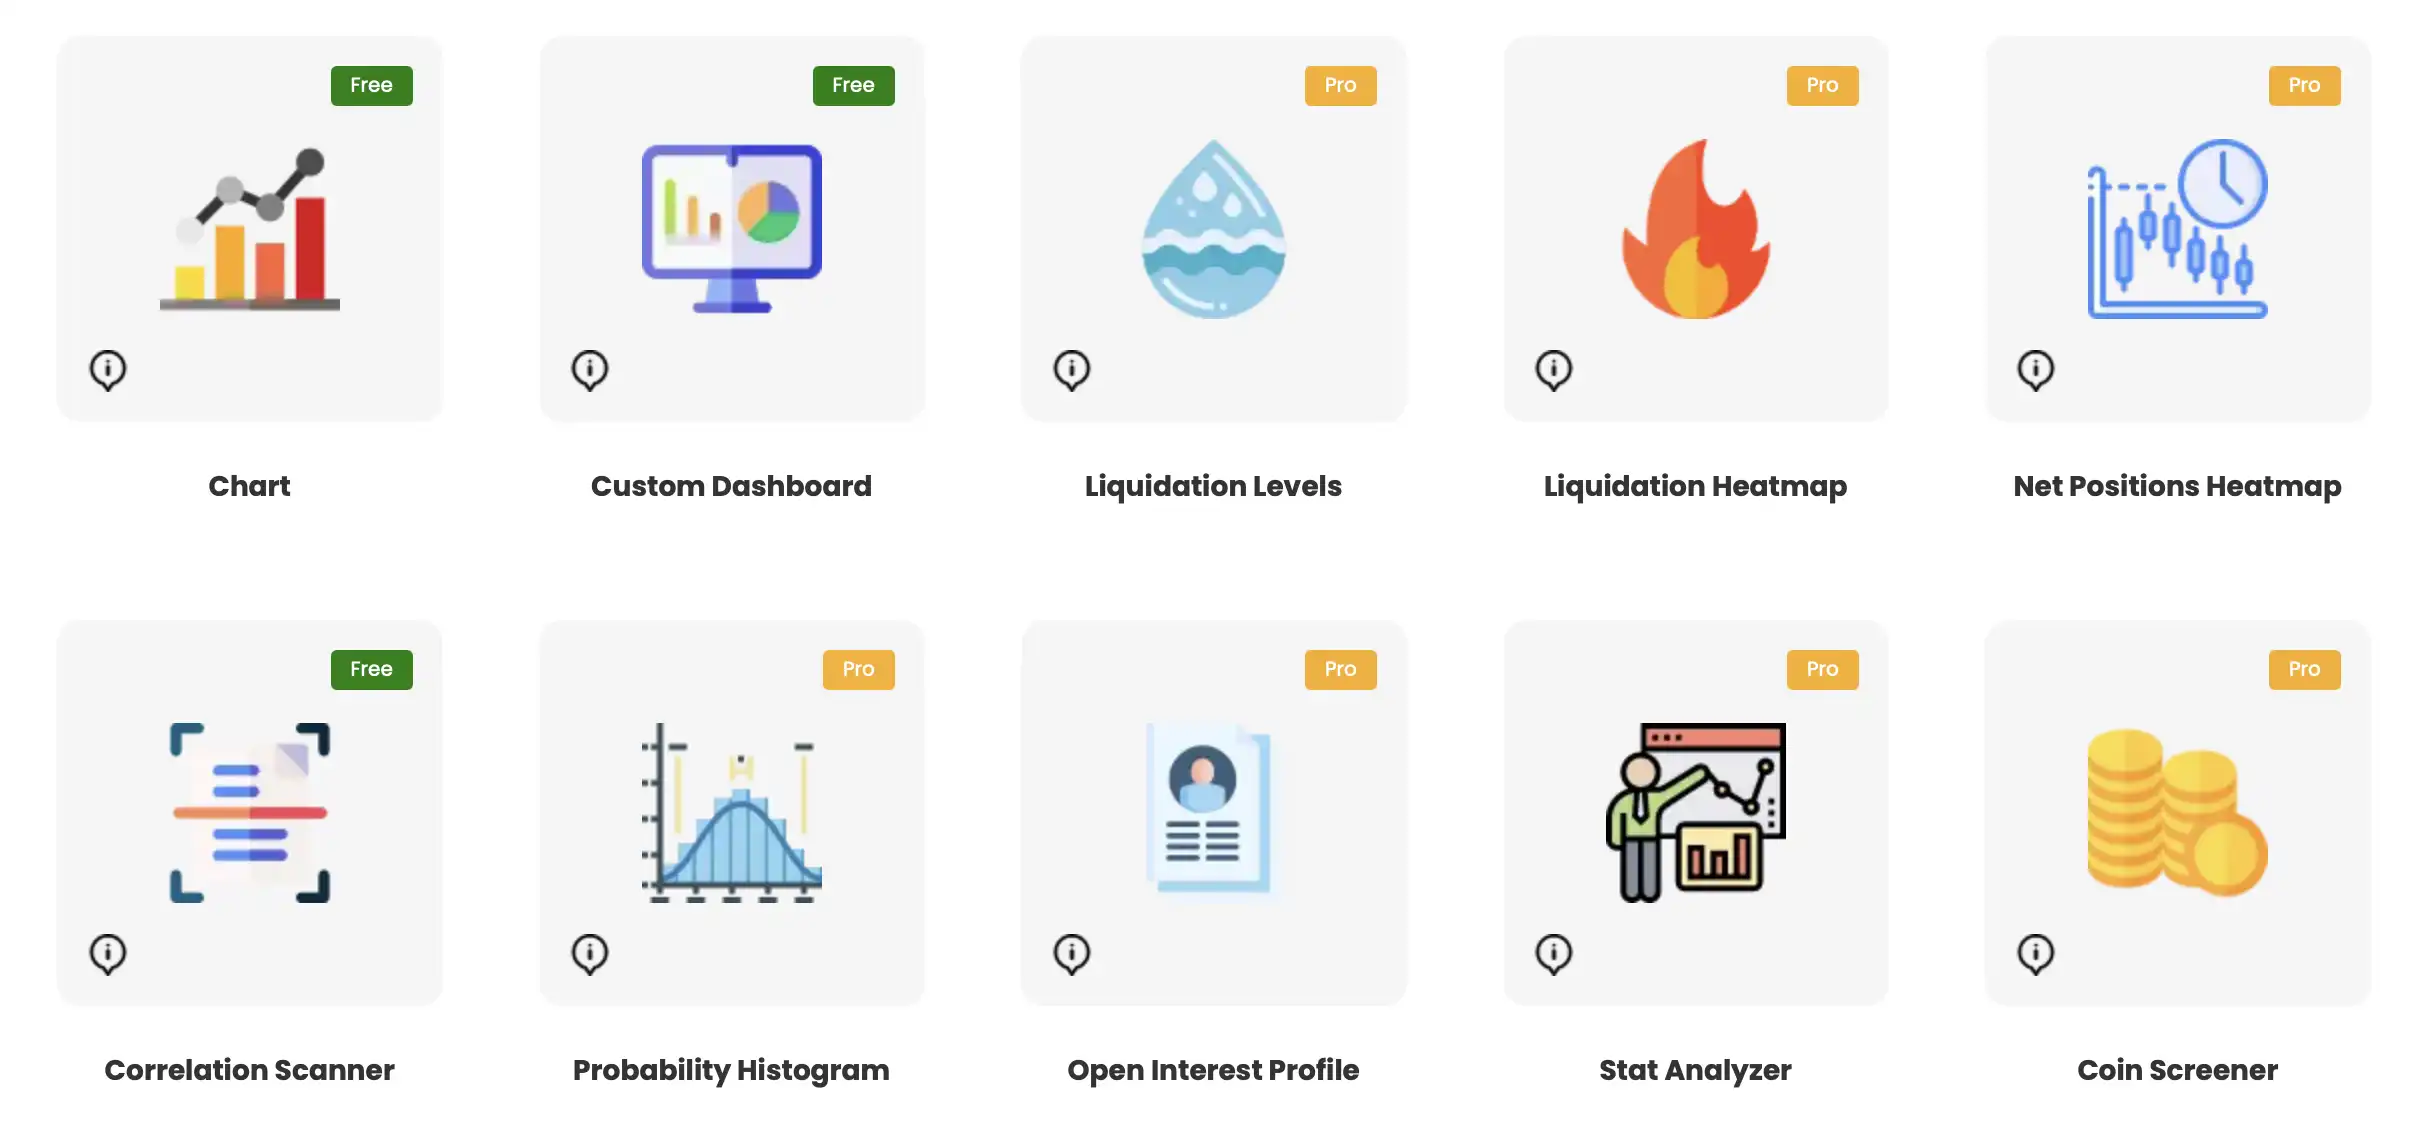
Из бесплатного хотелось бы отметить “Сканер Корреляции”, с помощью которого можно определить, какие крипто пары имеют сильную взаимосвязь.
Корреляция показывает линейную связь между двумя активами и находится в диапазоне от -1 до 1. Сильная корреляция (близкая к 1) указывает на то, что пара активов движется одинаково, в то время как сильная отрицательная корреляция (близкая к -1) указывает на то, что пара активов имеет обратную зависимость (они движутся в противоположных направлениях). Коэффициенты корреляции, близкие к 0, указывают на отсутствие линейной связи.
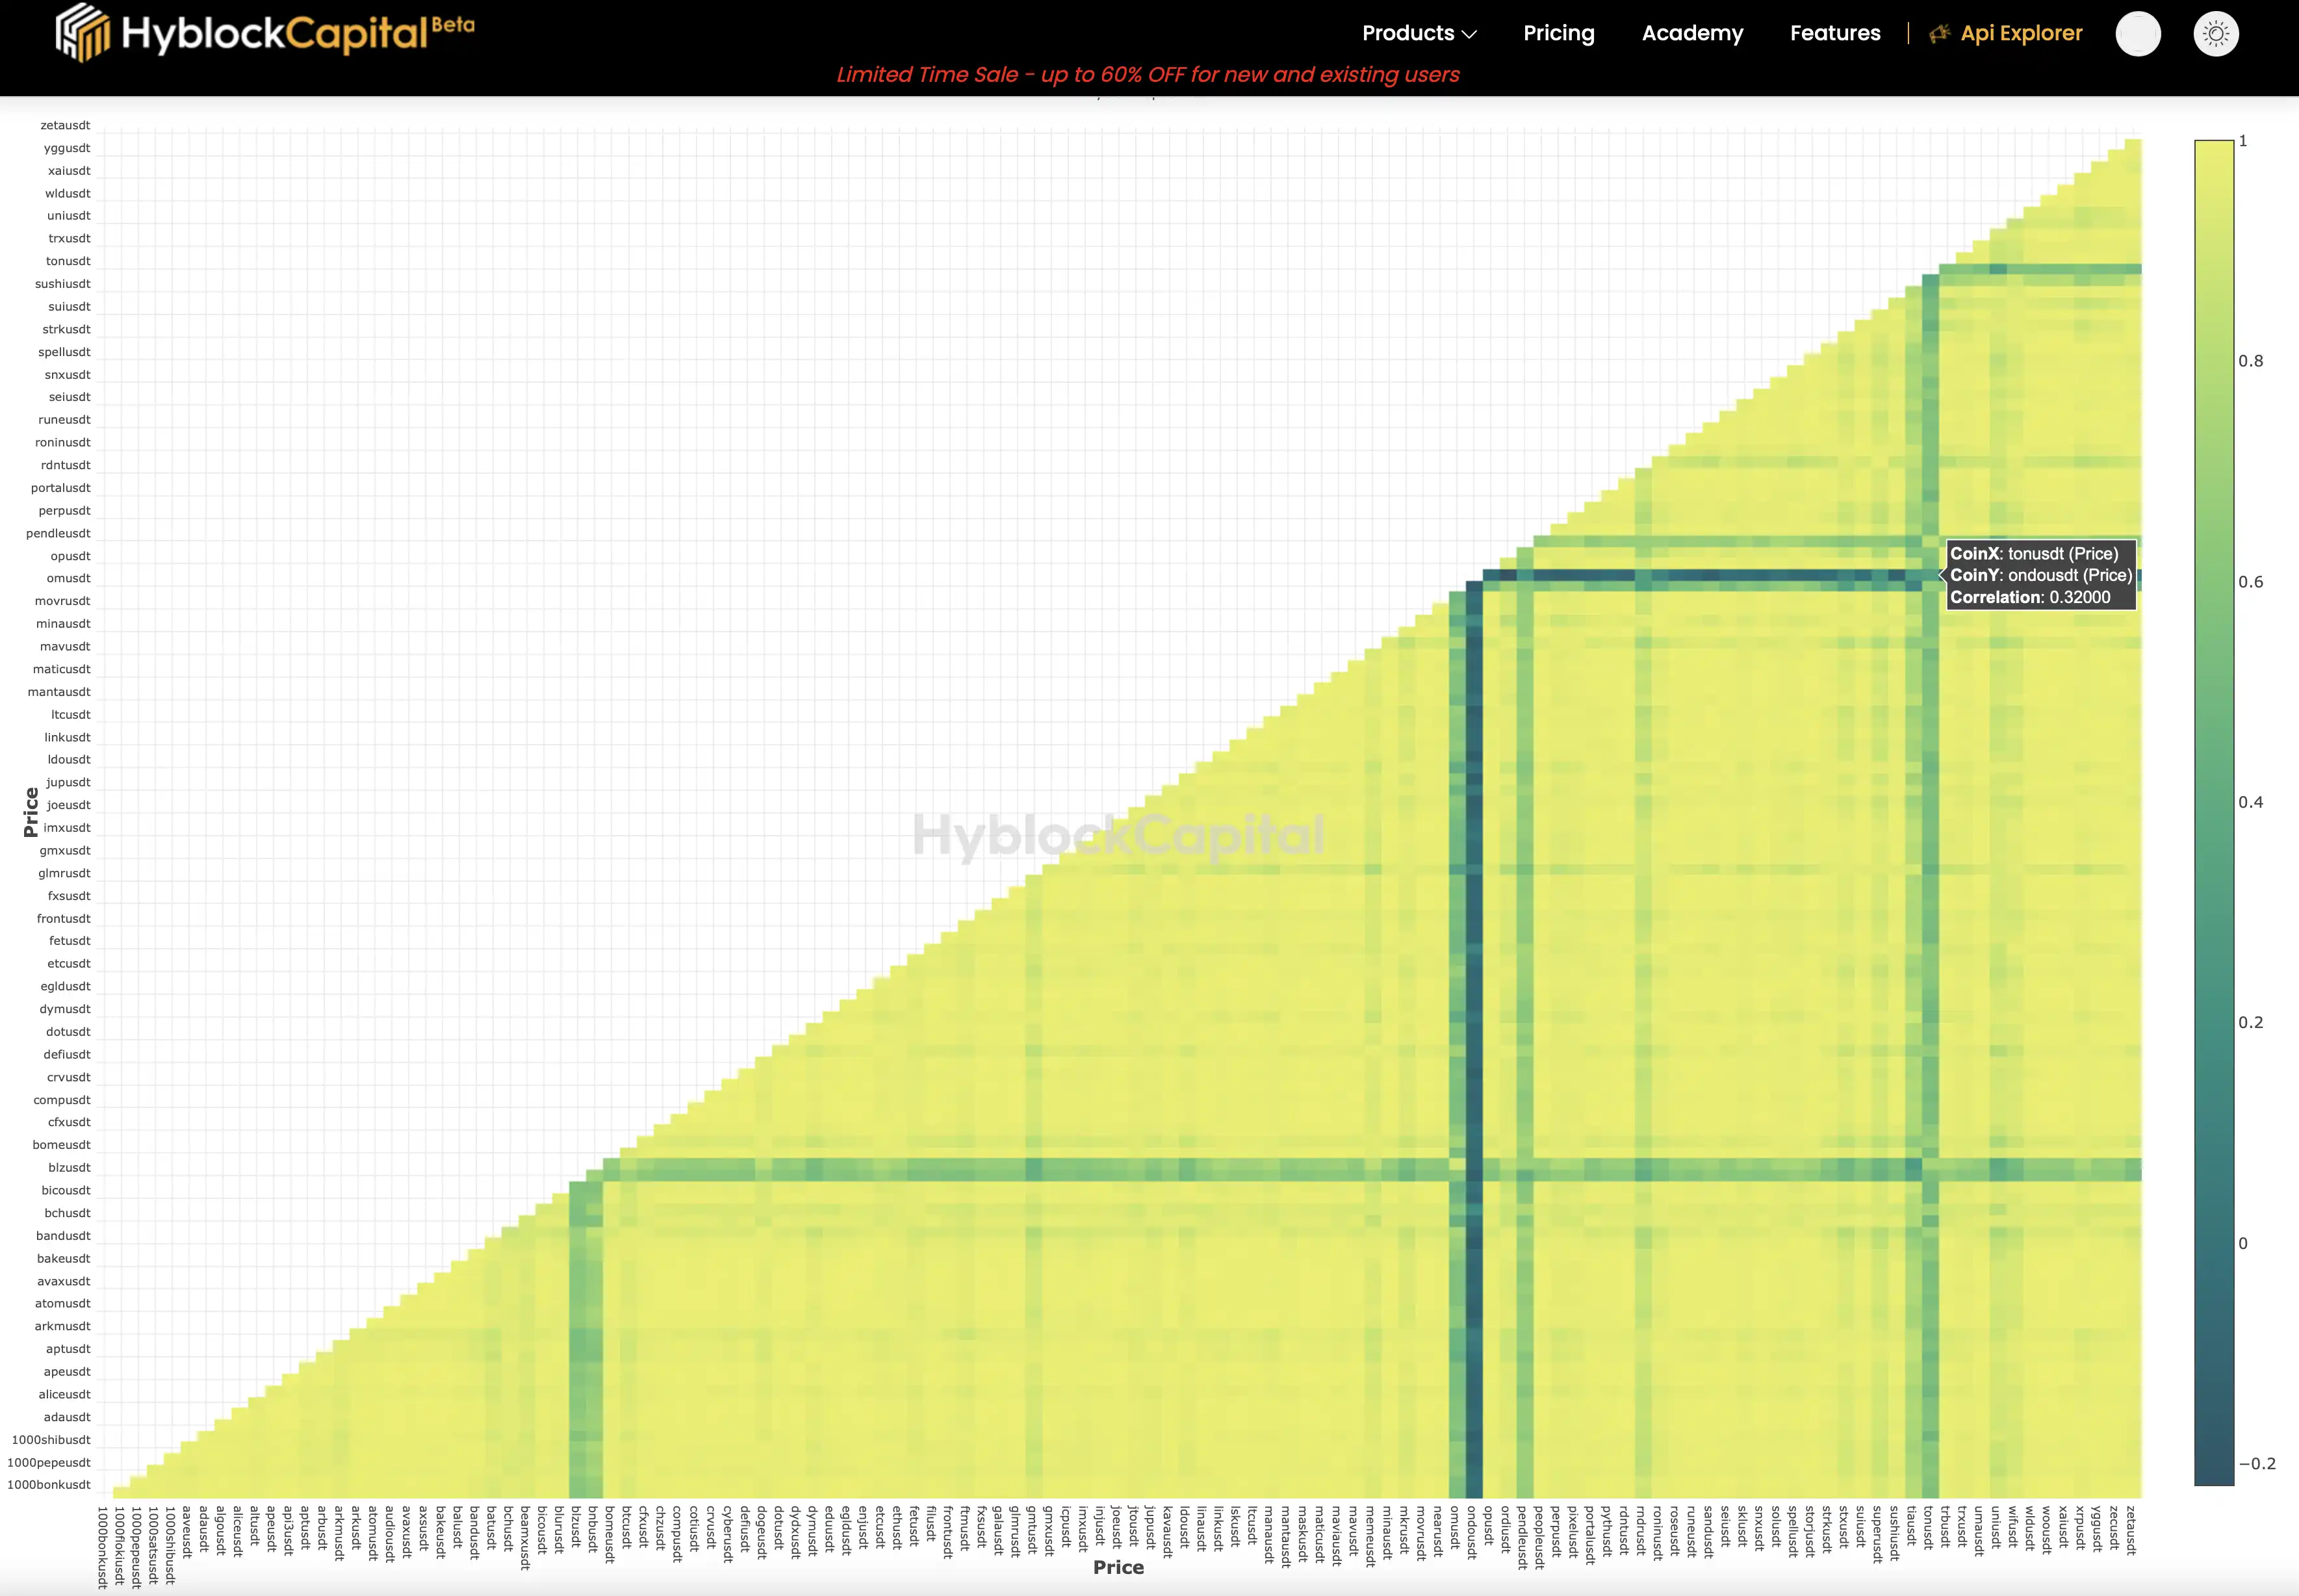
График корреляции крипто пар
Остальные полезные метрики требуют оплаты подписки PRO, а она является достаточно дорогостоящей: самая дешевая месячная подписка стоит 79$ на сегодняшний день.
Ресерч перед инвестированием: советы команды CRYPTOLOGY KEY
Тщательный анализ перед инвестированием позволяет инвесторам не только избегать нежелательных убытков, но и выявлять уникальные возможности для получения дохода – именно здесь на помощь к нам приходят ресурсы для анализа криптопроектов, о которых мы говорили сегодня и в первой части.
Если мы говорим об инвестировании в какие-то новые проекты, то неплохим вариантом будет попытка исследовать, кто в них инвестировал, как давно и как много – для этого мы можем обратиться к платформе Arkham Inteligence. Она сфокусирована на исследовании сущностей и их он-чейн активностей. Сервис предоставляет подробные данные о кошельках, транзакциях, связях между адресами и реальными организациями/людьми. При правильном использовании платформы, вы можете существенно упростить себе поиск крутых проектов, ранних гемов и отслеживание движений токенов.
Для инвесторов также очень полезной будет платформа DropsTab, поскольку на ней можно найти информацию о раундах финансирования, проведенных различными криптовалютными стартапами, разлоках токенов и многом другом.
Туда же можем отнести и Messari.io. На этой платформе вы найдете очень большое количество ончейн-данных как про отдельно взятый проект, так и про целые сегменты рынка. На Messari.io можно найти и информацию о предстоящих листингах, токенсейлах, аирдропах – отличное место для поиска возможностей любителям проектов.
Если говорить о трейдинге, то тут на помощь придут незаменимый CoinGlass, на котором можно удобно отследить ставки финансирования, статистику по ликвидациям и открытым позициям на криптовалютных биржах. CoinGlass предлагает обширный и качественный набор данных, который окажется ценным инструментом в арсенале любого крипто трейдера.
Поиск информации перед принятием решения может добавить вам уверенности в его правильности, либо, наоборот, поставить его под сомнения – что тоже очень важно для того, чтобы решение об инвестировании или открытии позиции было взвешенным. Таким образом, прибегание к подобным площадкам и ресурсам с ончейн-метриками, может неплохо помочь вам как трейдеру или инвестору. Однако, всегда помните, что делать выводы только на основе ончейн-данных тоже не стоит, всегда изучайте вопрос со всех сторон: если дело касается трейдинга, вы ни в коем случае не должны открывать лонг только по причине определенного соотношения лонгов и шортов, у вас всегда должен быть список причин, из-за которых вы сделали такое решение.
Для чего я могу использовать платформу CoinGlass?
Чем особенный DropsTab?
Чем полезна платформа Messari?
Кроме того, там можно найти информацию о предстоящих листингах, токенсейлах, аирдропах.
Как можно использовать Arkham Intelligence?
Что такое Hyblock Capital?

Тогда расскажи друзьям – пусть тоже прокачивают свои навыки. Поделиться можно легко с помощью кнопок внизу или просто скопировав ссылку. Мы будем рады твоим отметкам в соц. сетях!
Поделиться

Подписывайся на нашу email-рассылку и получай свежие аналитические обзоры, новости, инсайты и приглашения на прямые эфиры прямо в свой почтовый ящик. Никакого спама — только ценная информация для трейдеров!
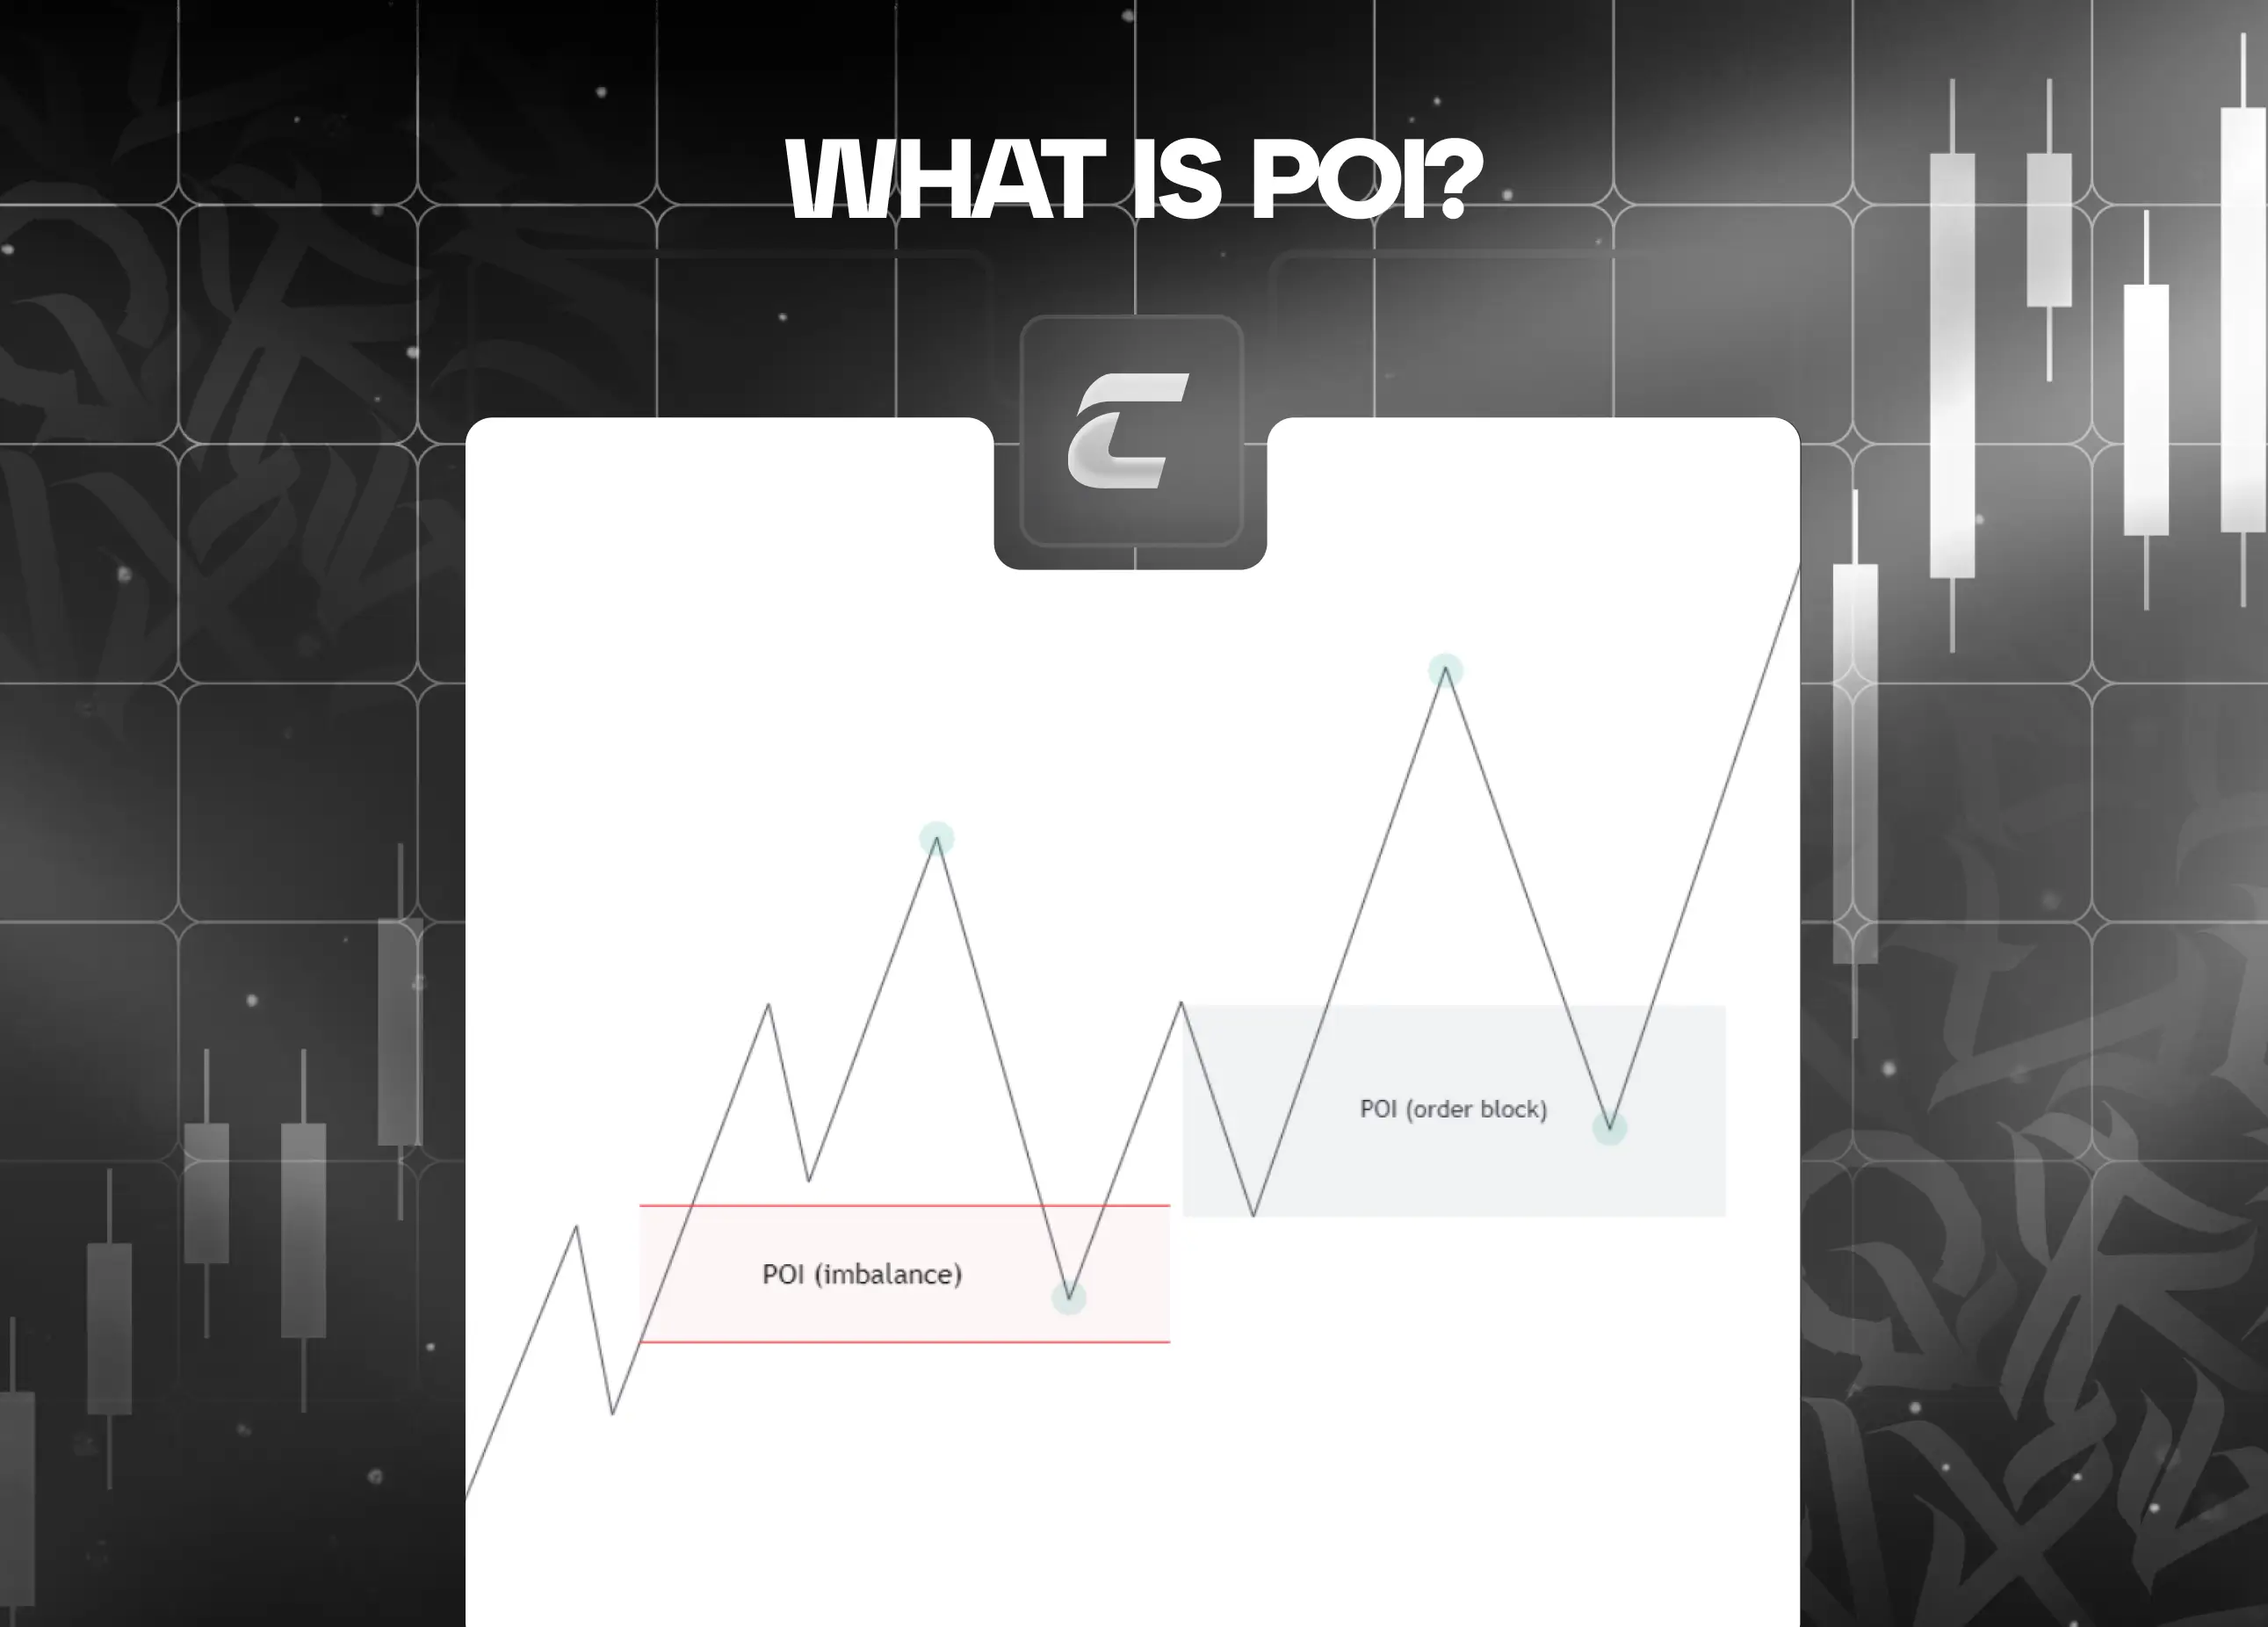
Что такое зона интереса (POI)

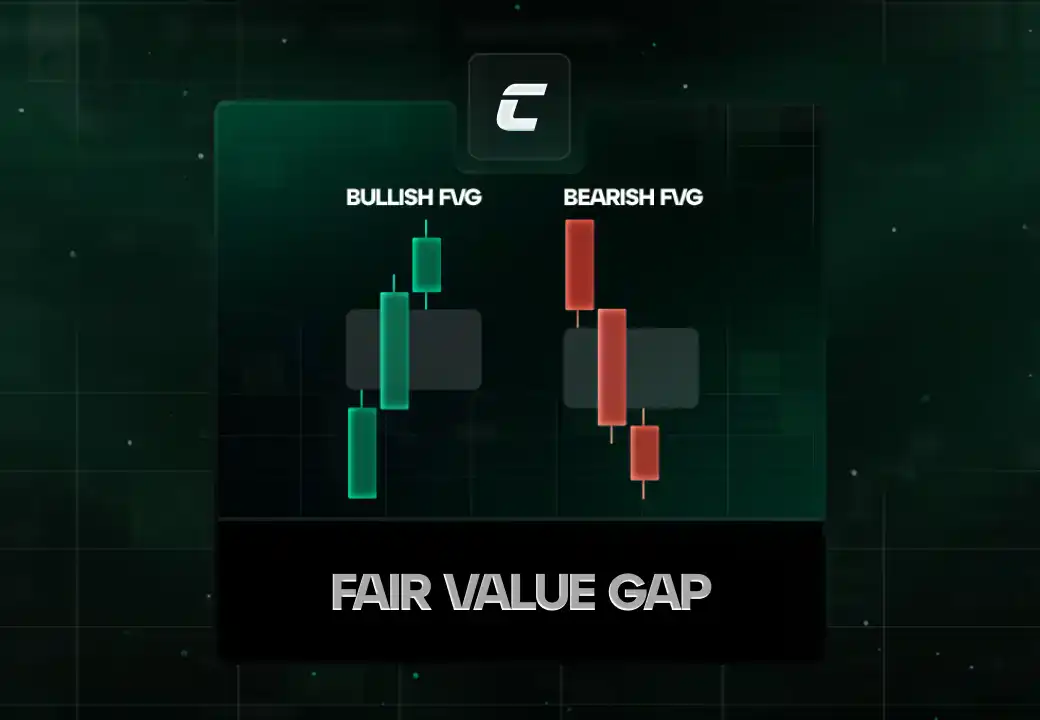
Разновидность: Fair Value Gap (FVG)

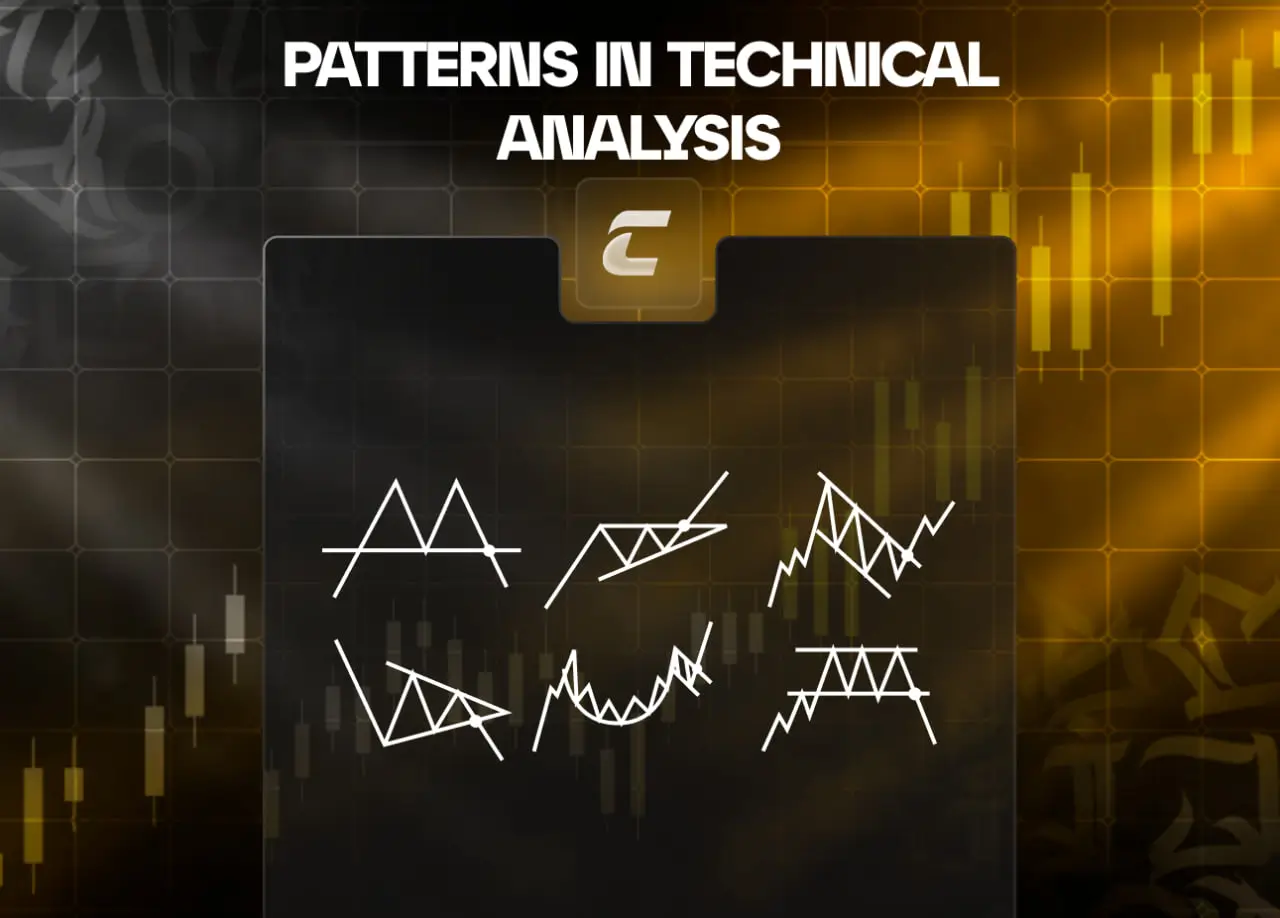
Что такое паттерн в техническом анализе
Что такое торговый журнал?

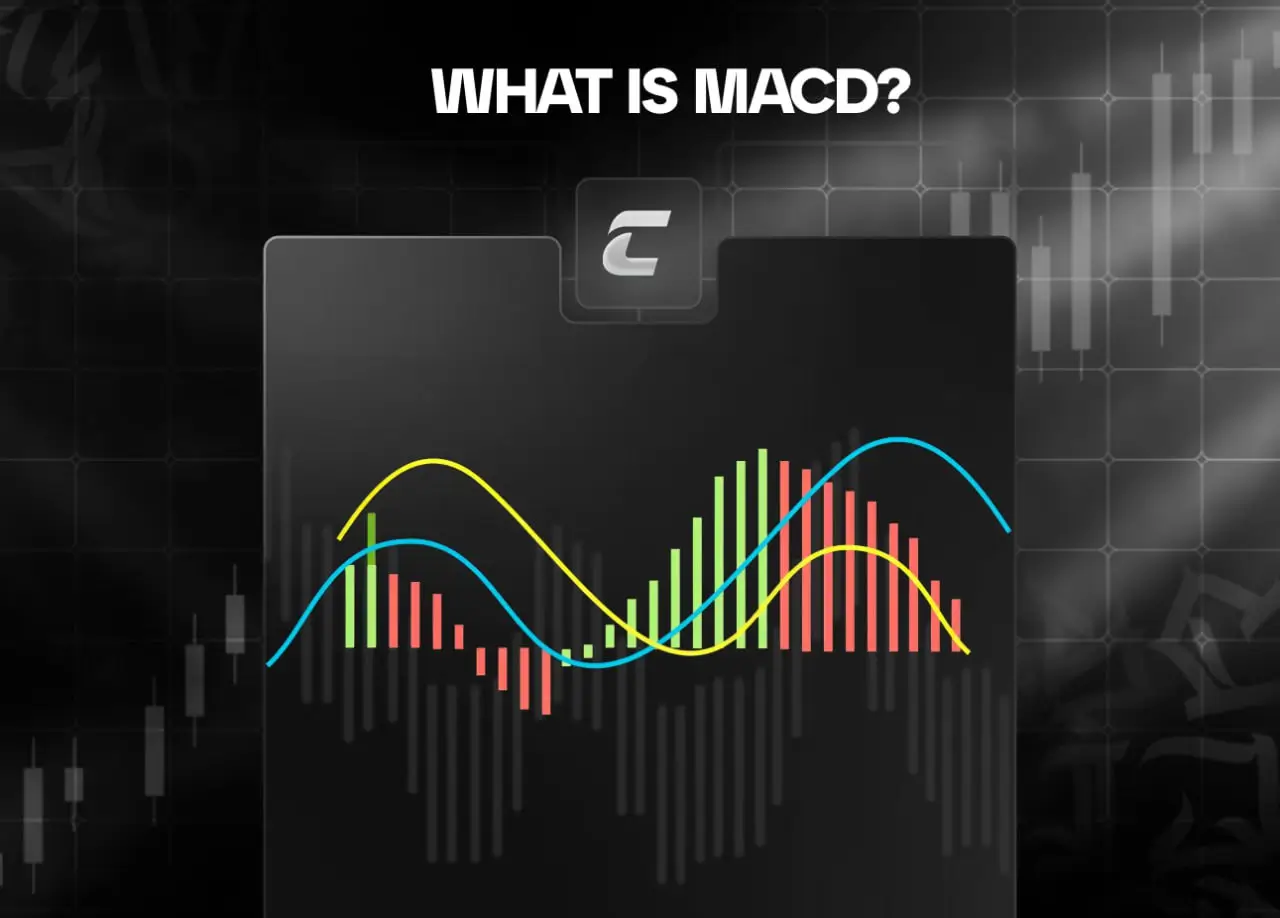
Что такое MACD

Страх. Что это такое и стоит ли избавляться от него? Ч2.

Что такое тикер и зачем он нужен?
Что такое CLS и как его использовать?