Последние статьи
Что такое котировка

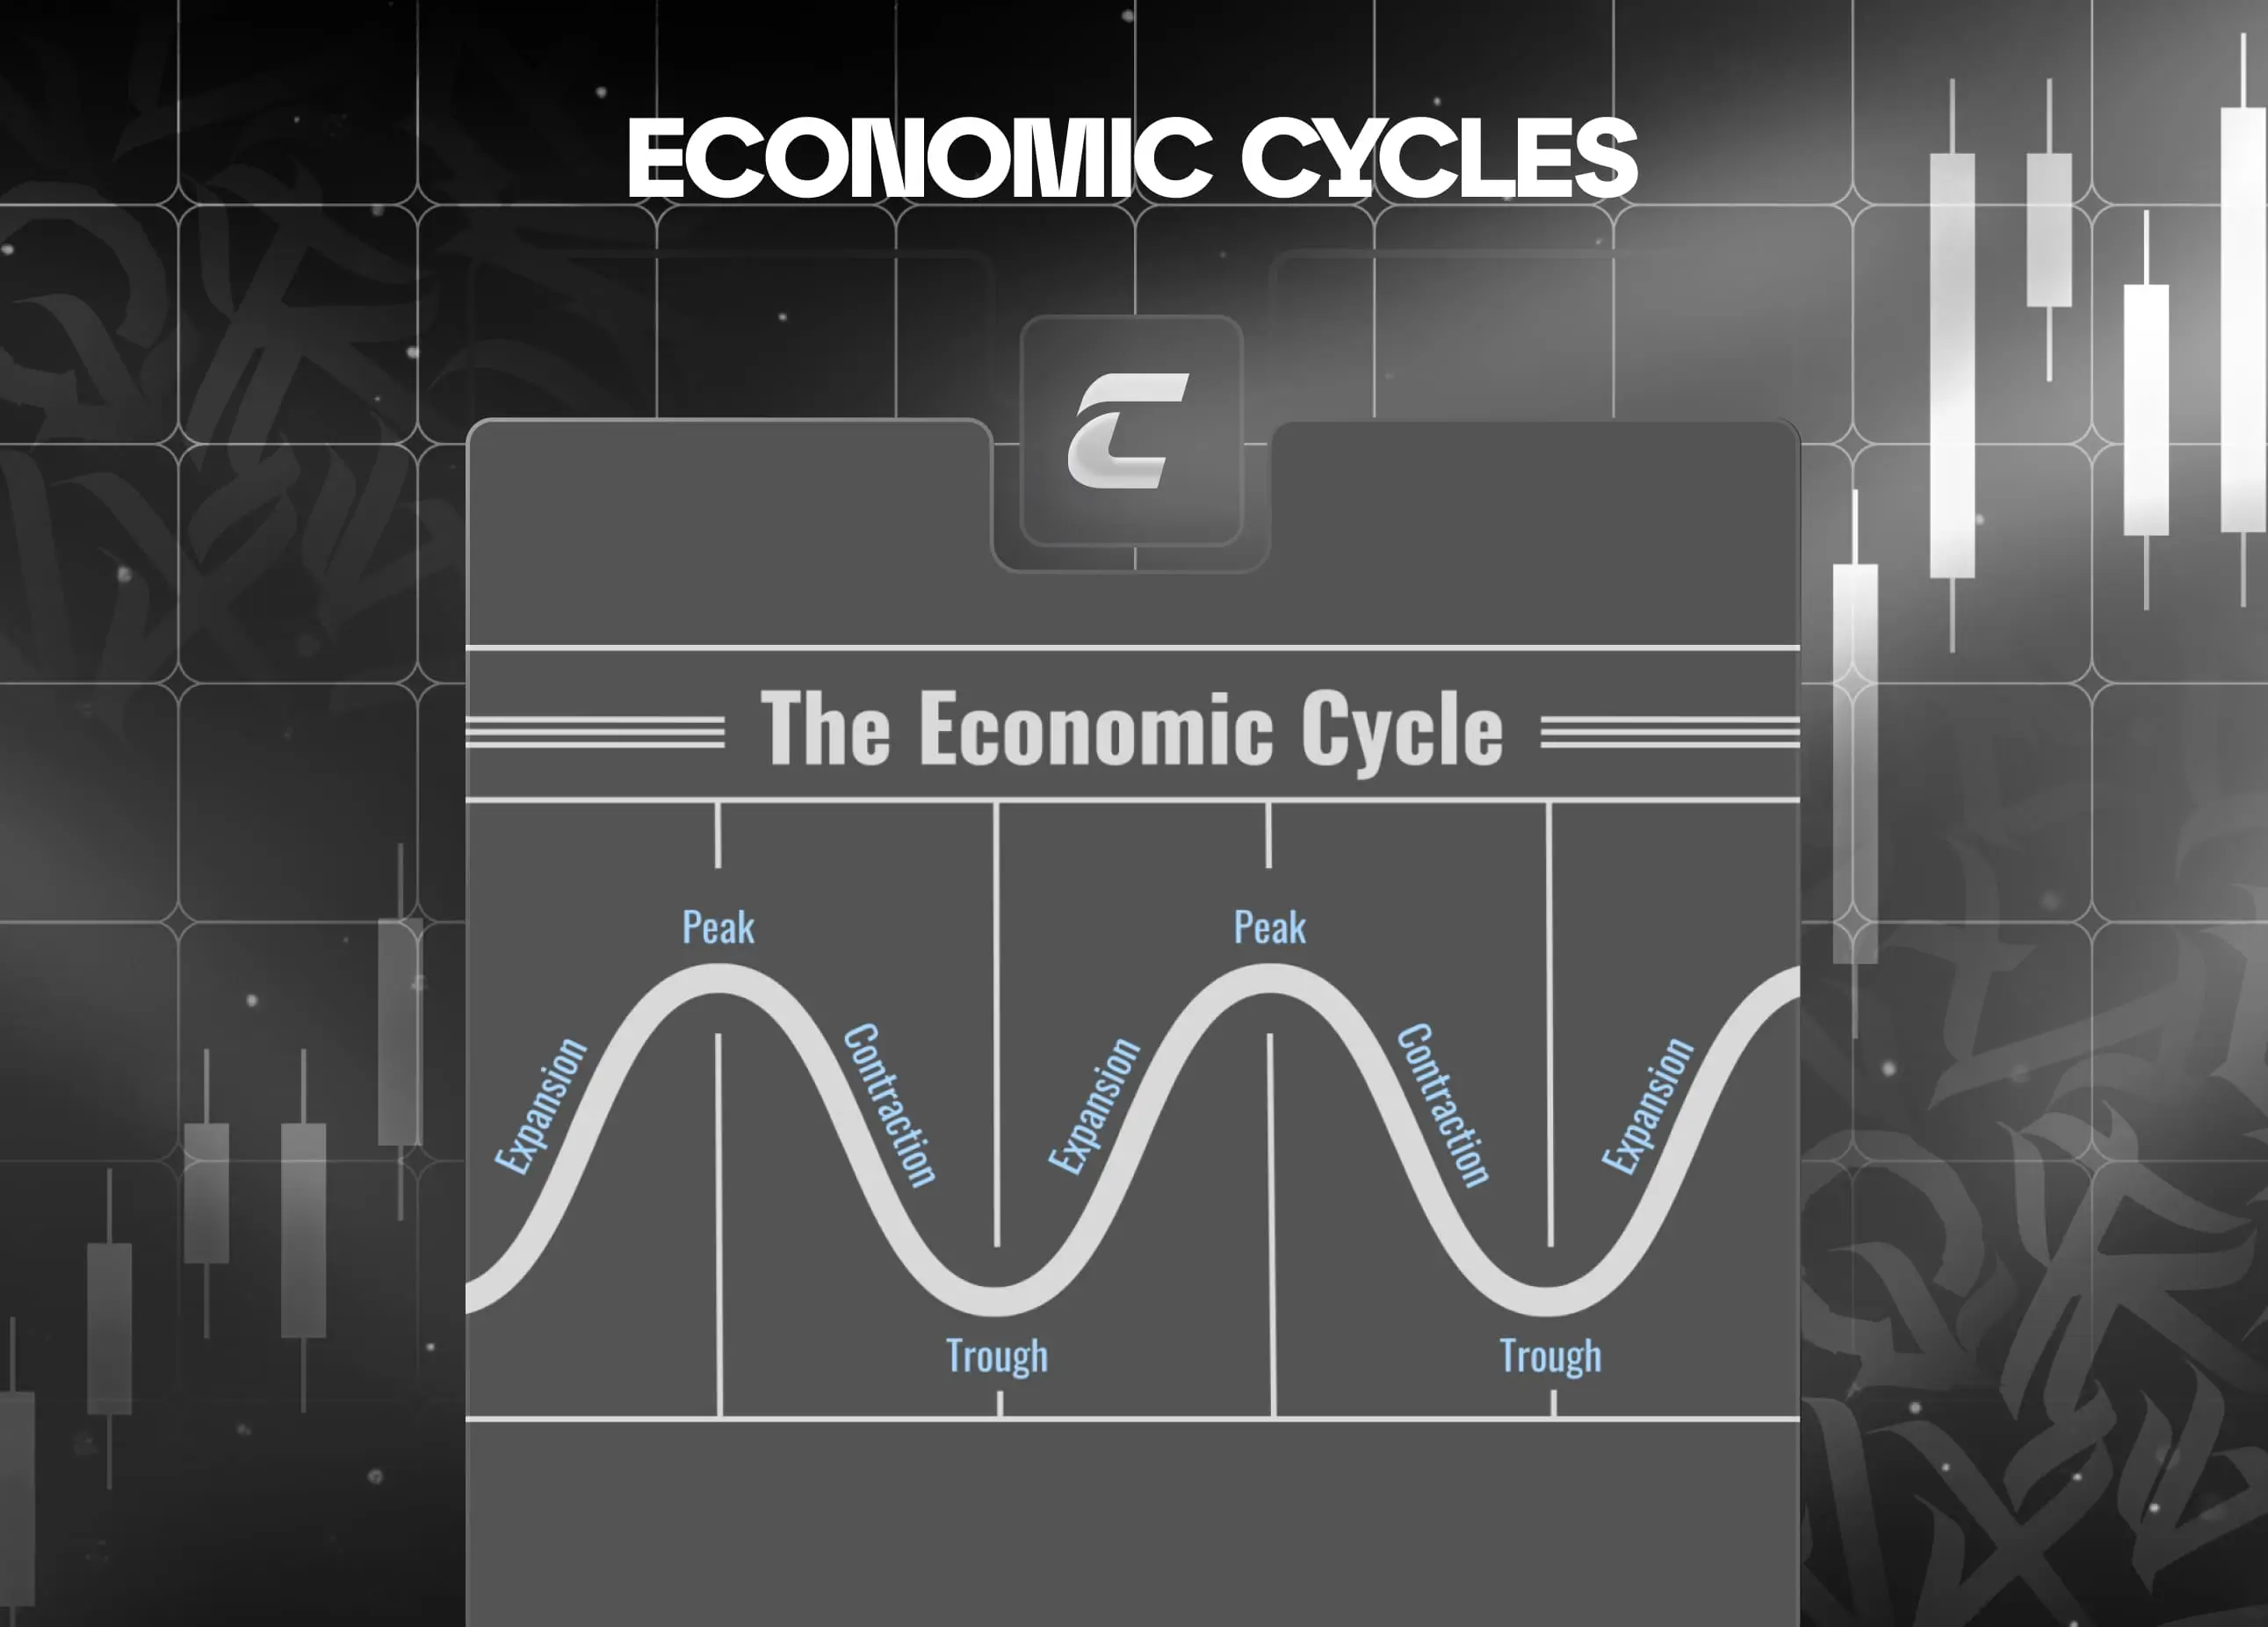
Что такое экономические циклы: фаза роста, пика, спада и восстановления
Как бороться с тревожностью во время открытой позиции
Ожидание быстрого результата: главный враг трейдера-новичка
Как пережить затяжную серию убыточных сделок

Отзыв студента: Сергей об обучении в Cryptology Key

Что такое теневая экономика и почему она мешает росту страны
Как перевести биткоин на другой кошелек
С какого возраста можно заниматься криптовалютой
Разница между дефицитом и профицитом бюджета
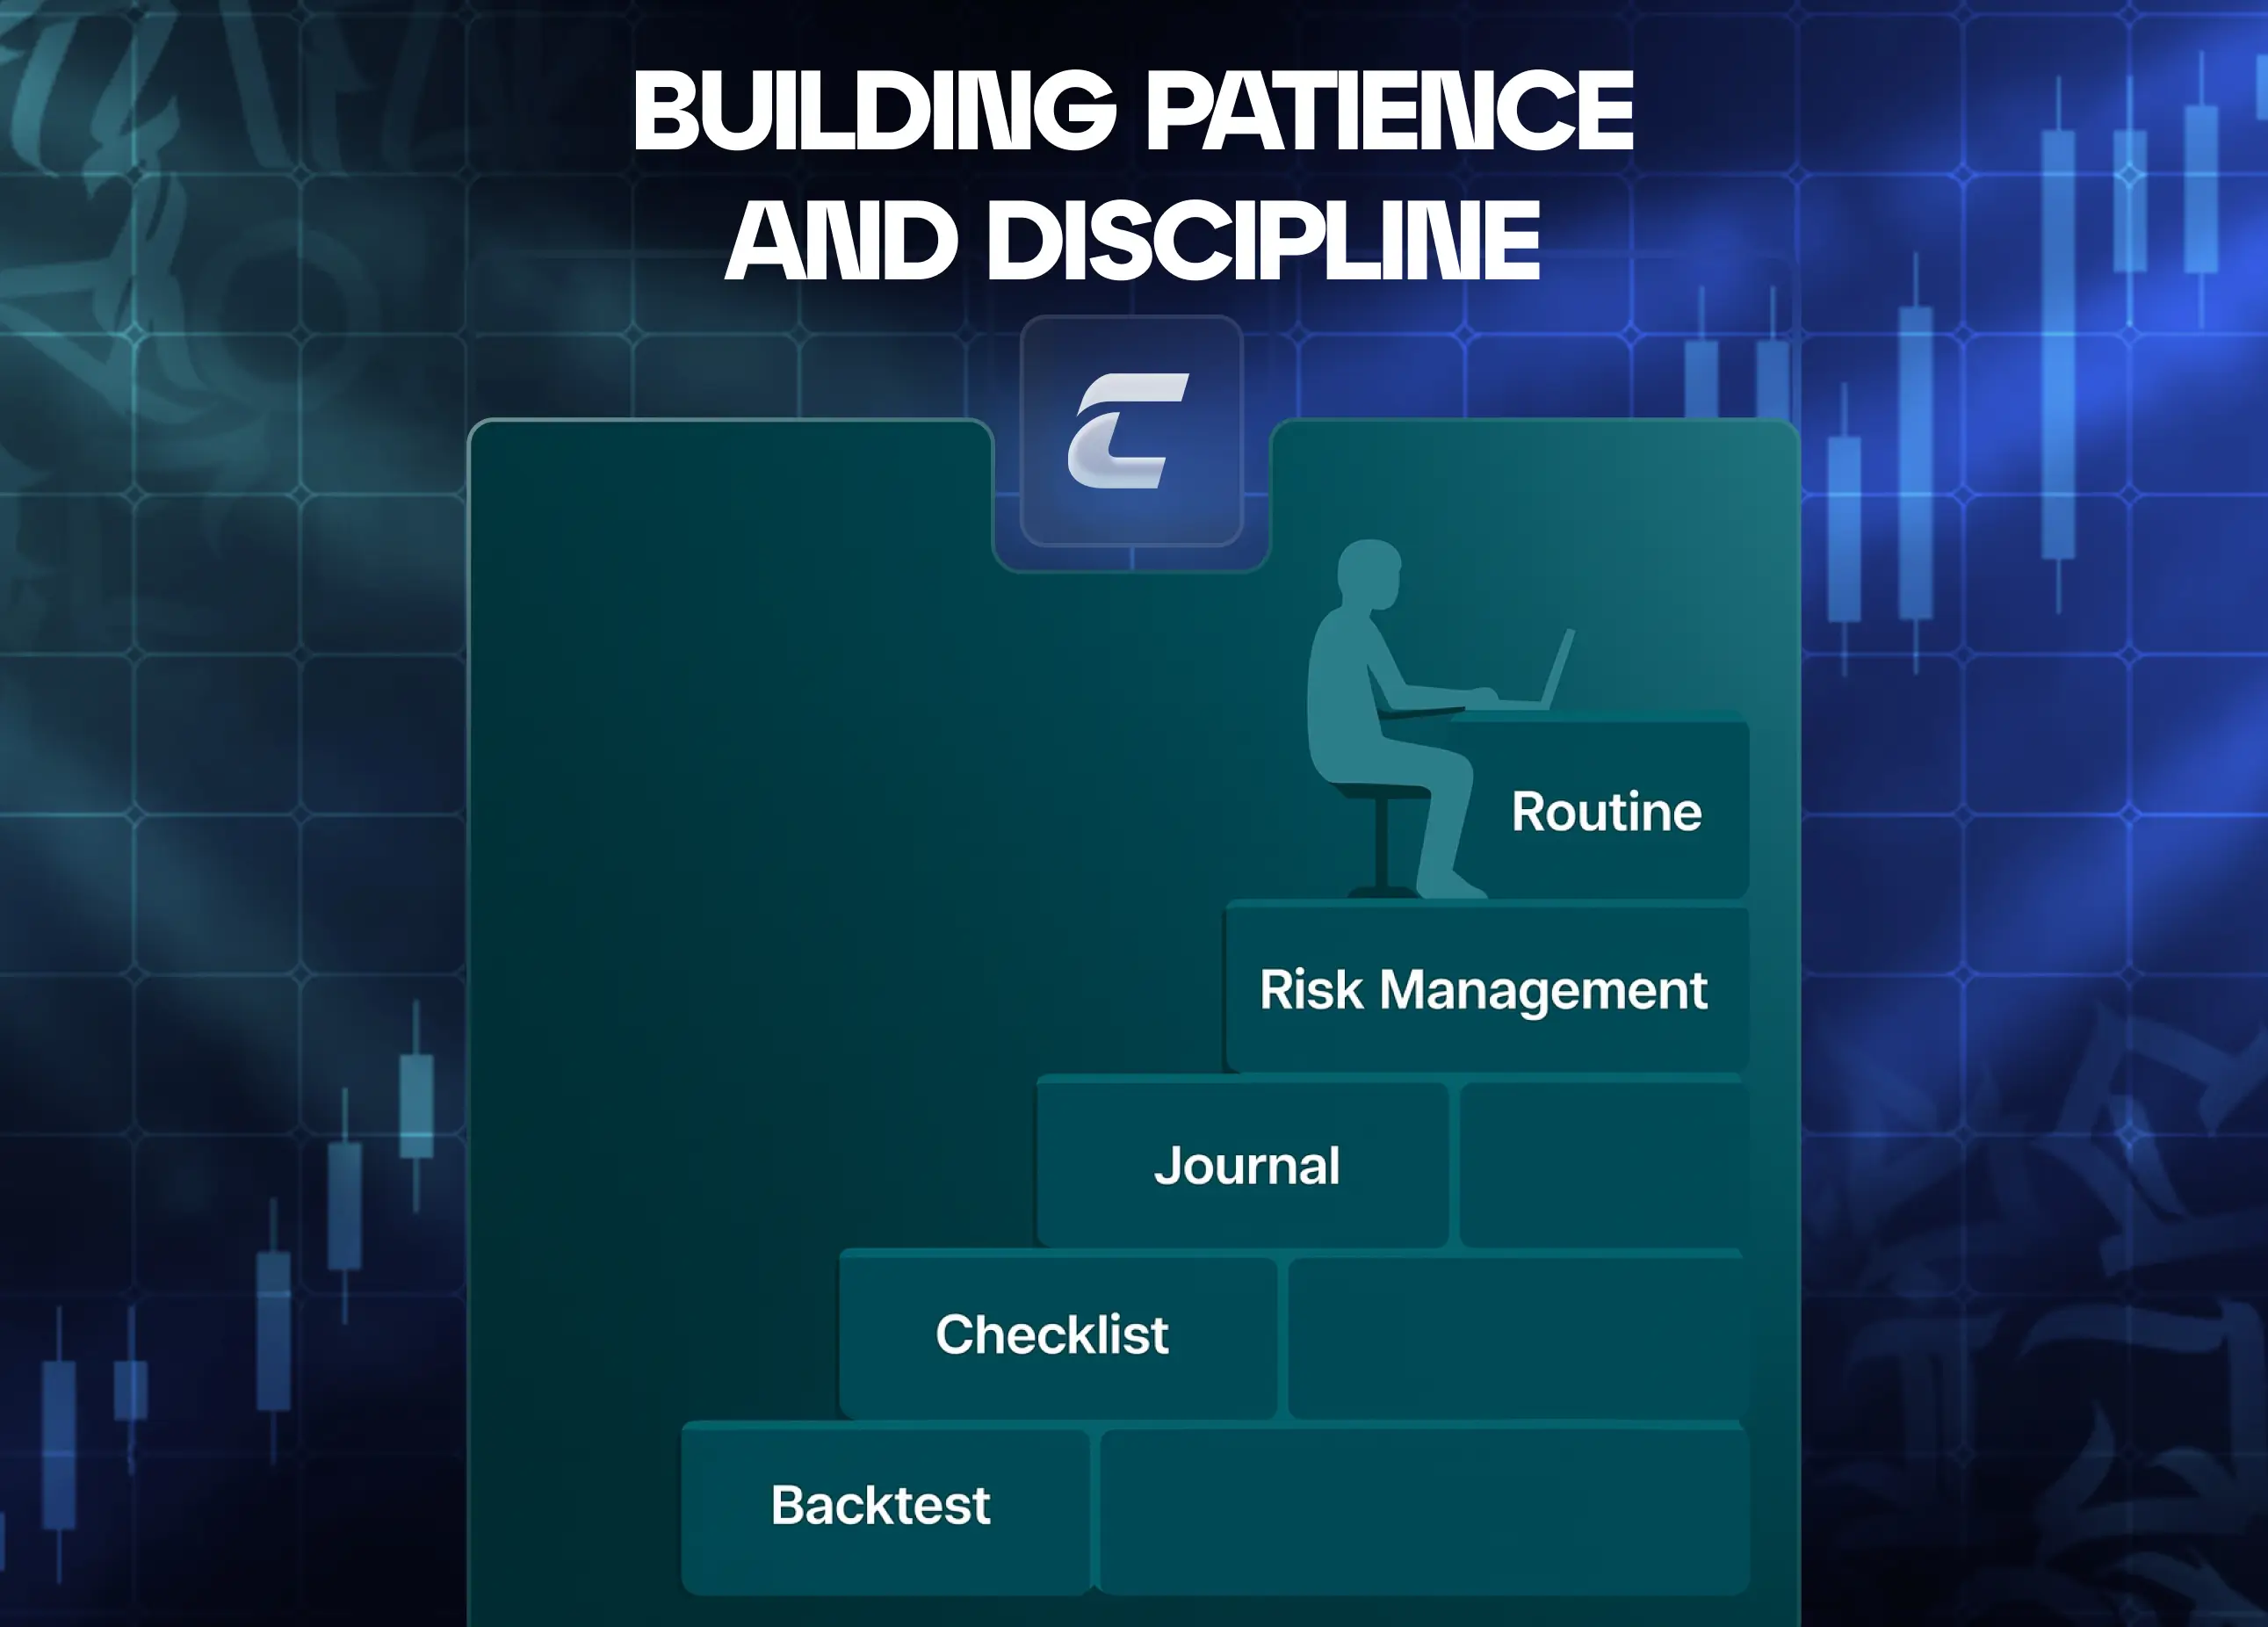
Как развить терпение и дисциплину – не на словах, а на практике


Отзыв студента: Артем об обучении в Cryptology Key