Последние статьи
Что такое монополия?

Что такое макроэкономика
Что такое майнинг-пул (mining pool) и как он работает
Что такое инвестиционный портфель и зачем его собирать?
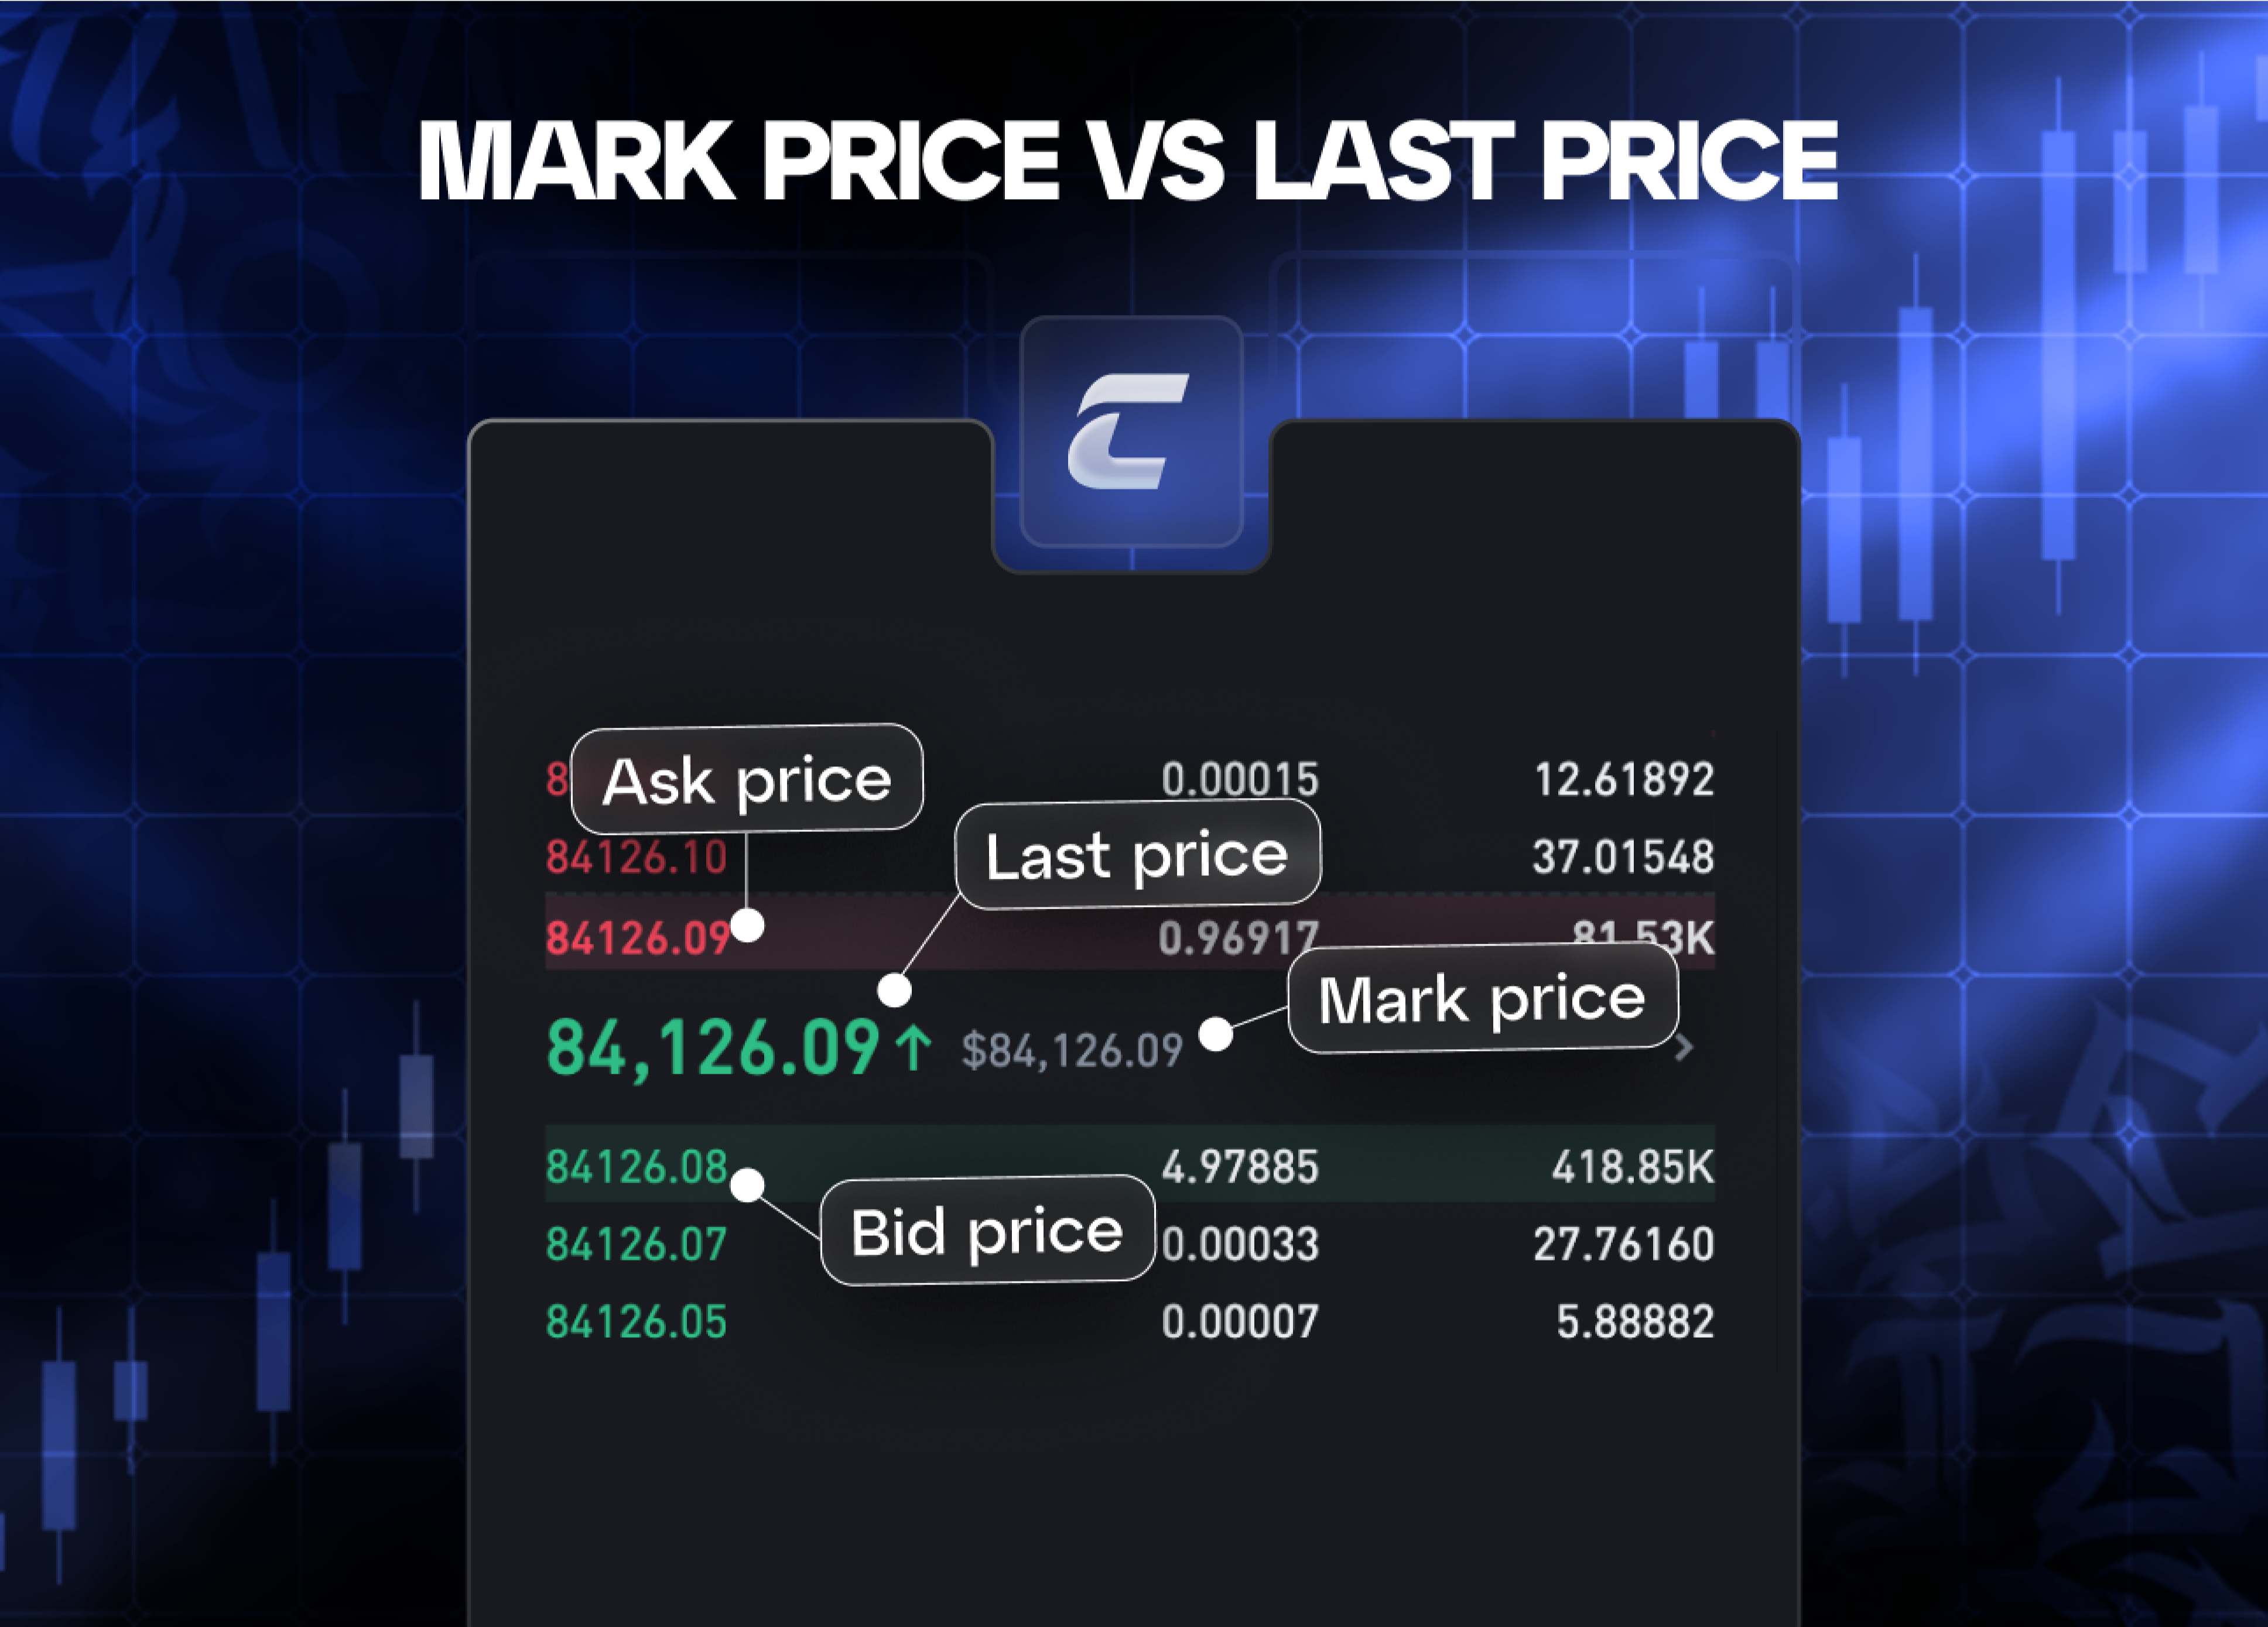
В чем разница между ценой маркировки и последней ценой?

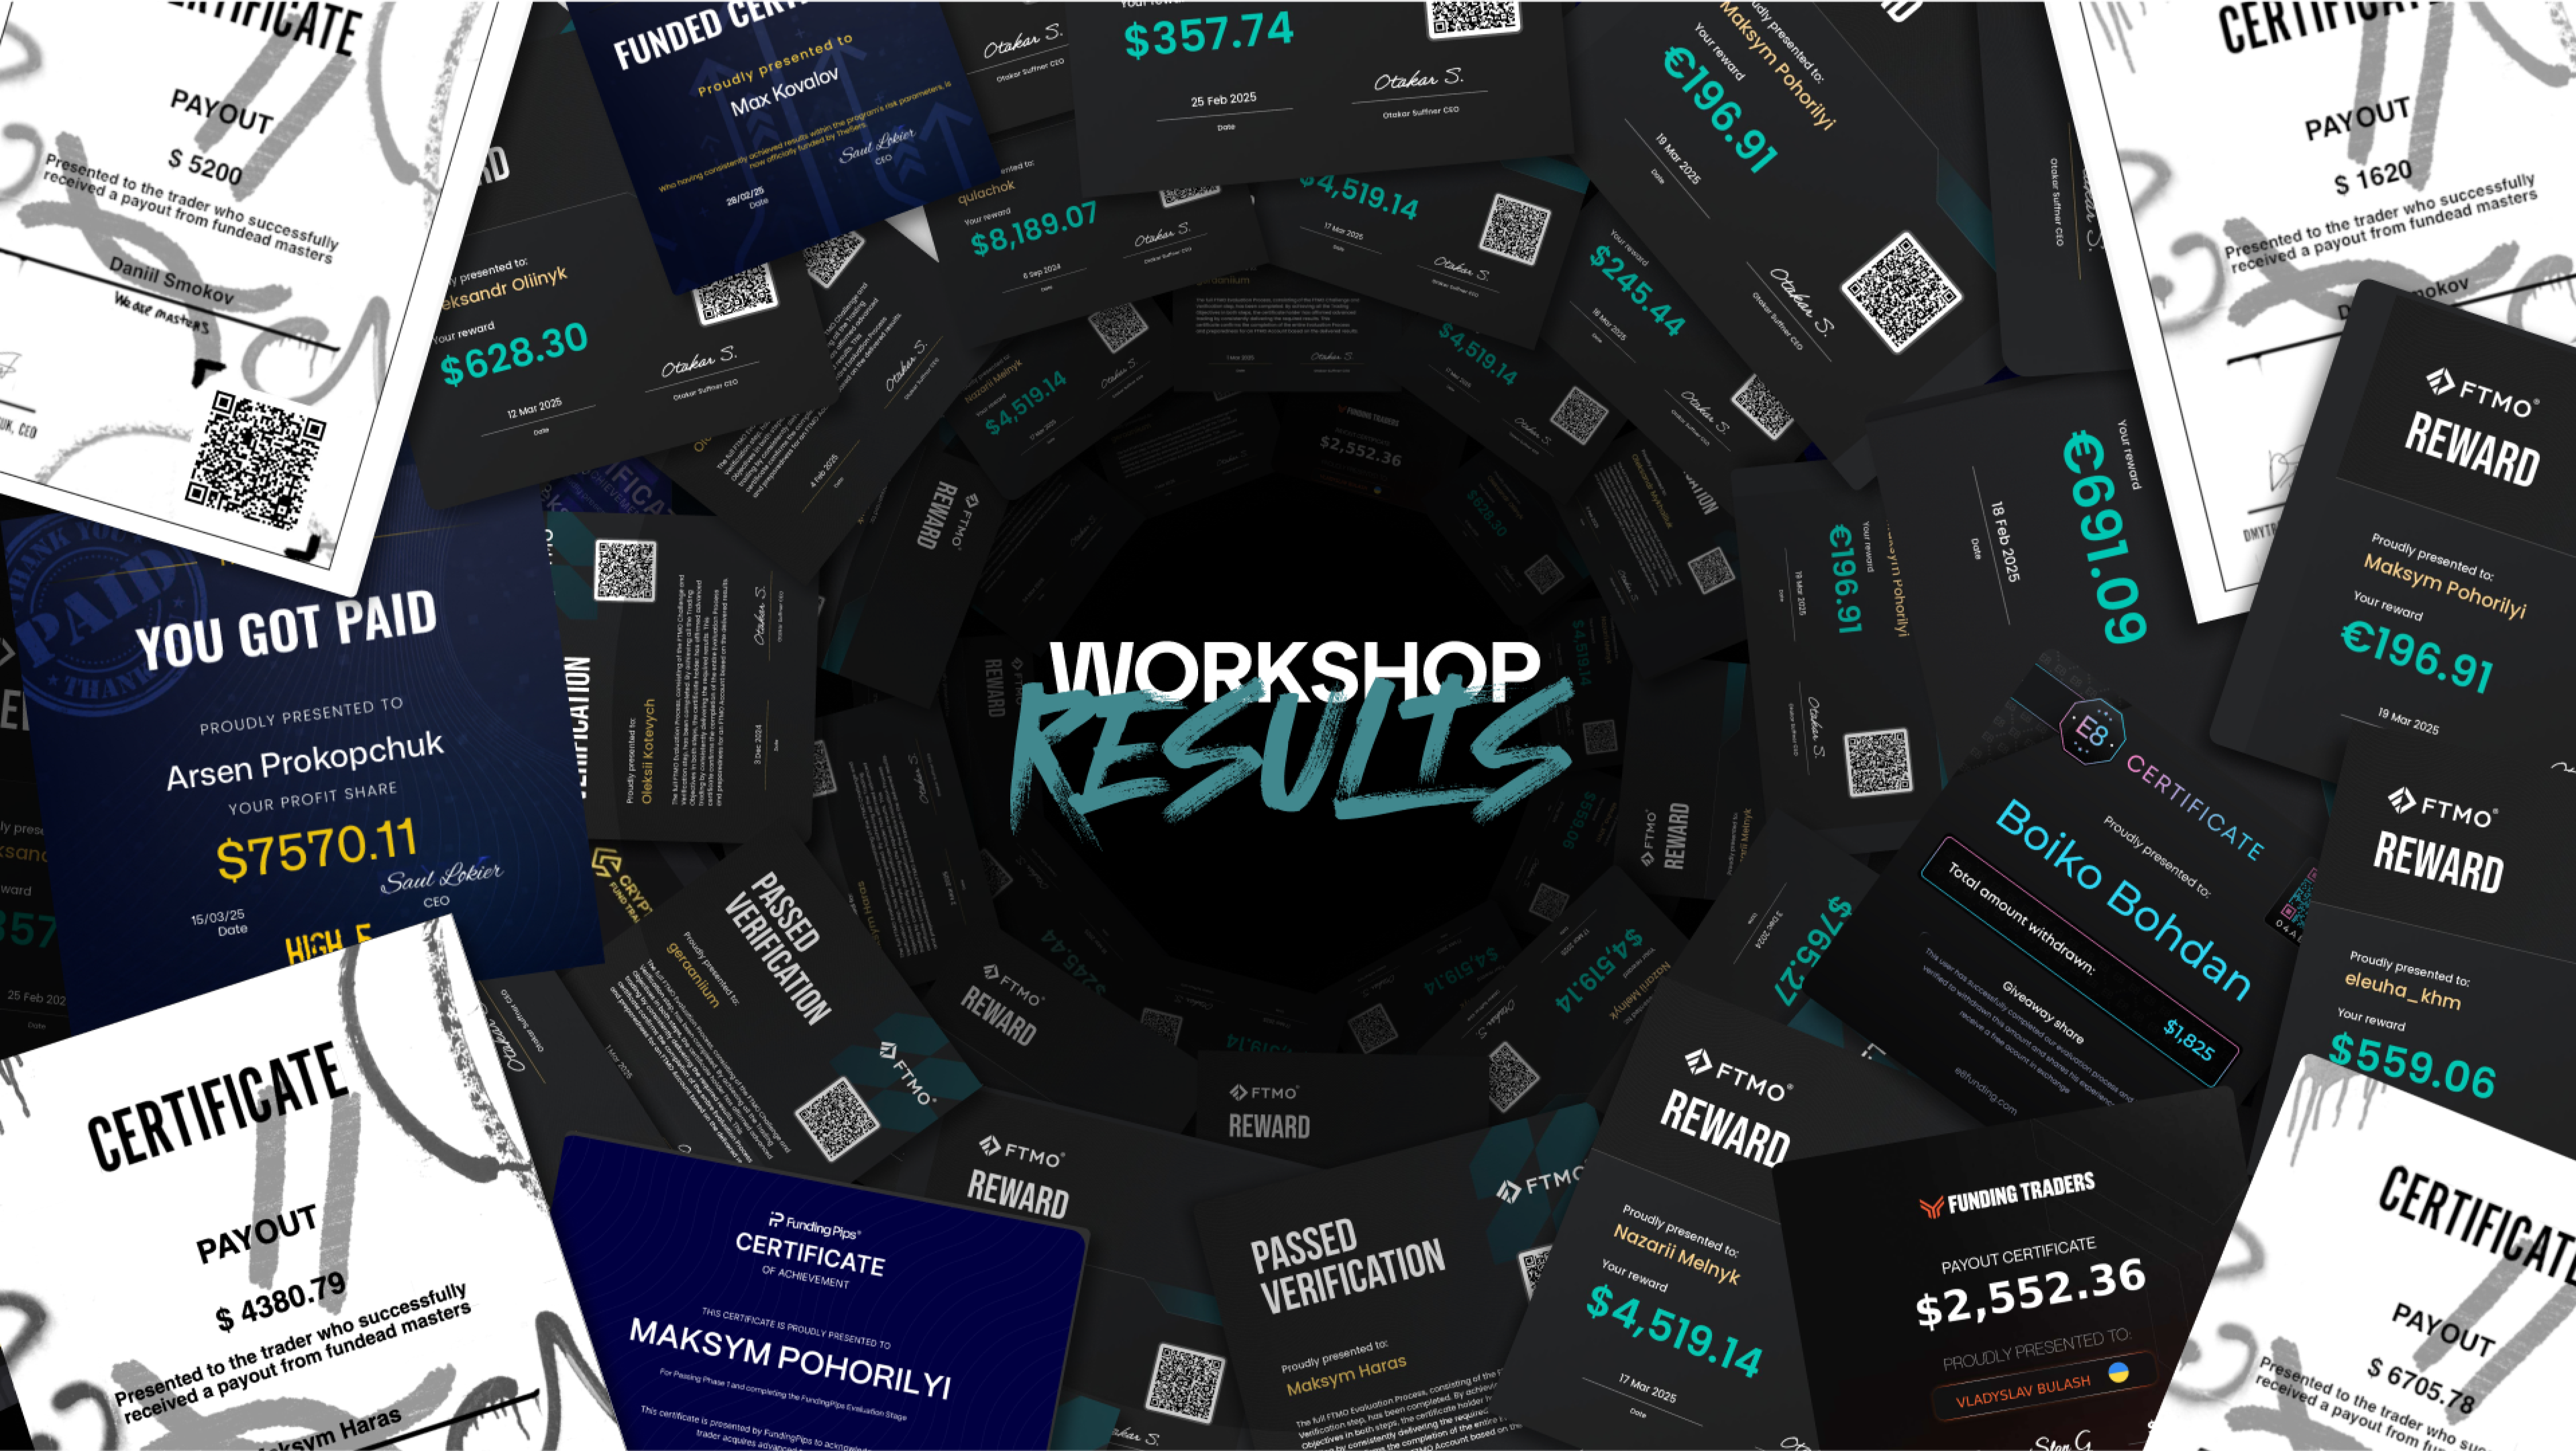
Результаты Workshop V10

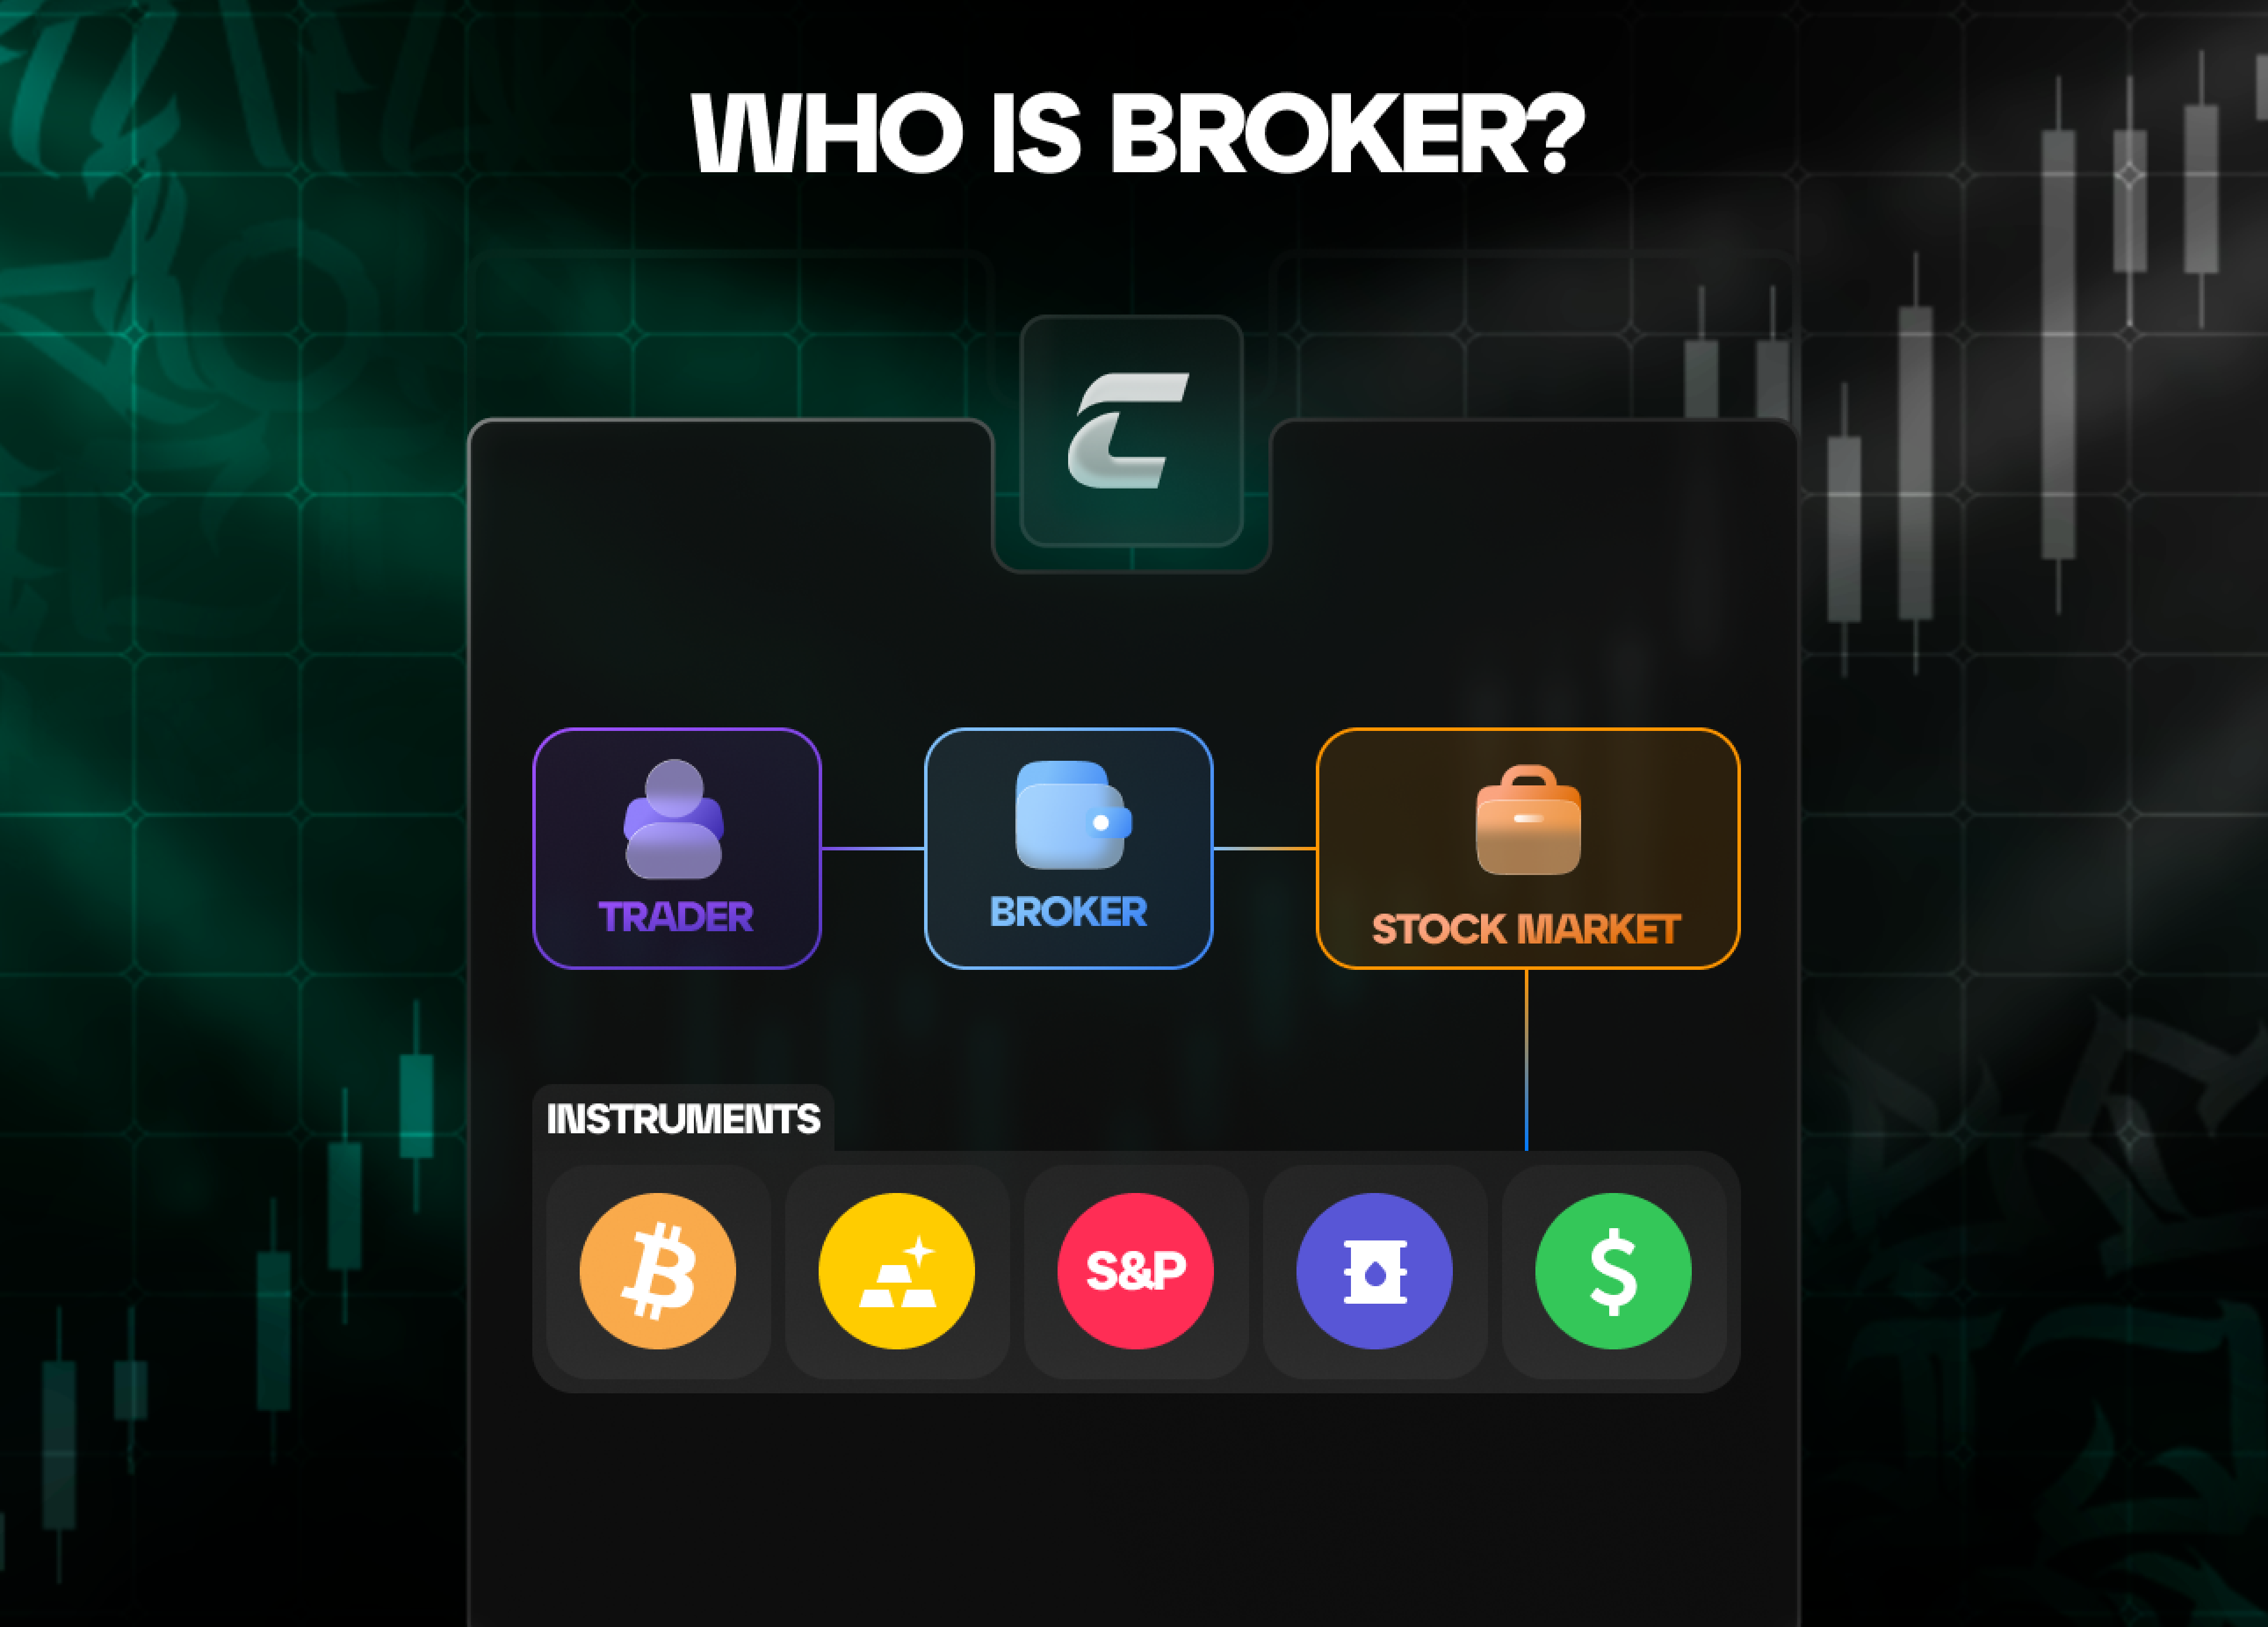
Кто такой брокер
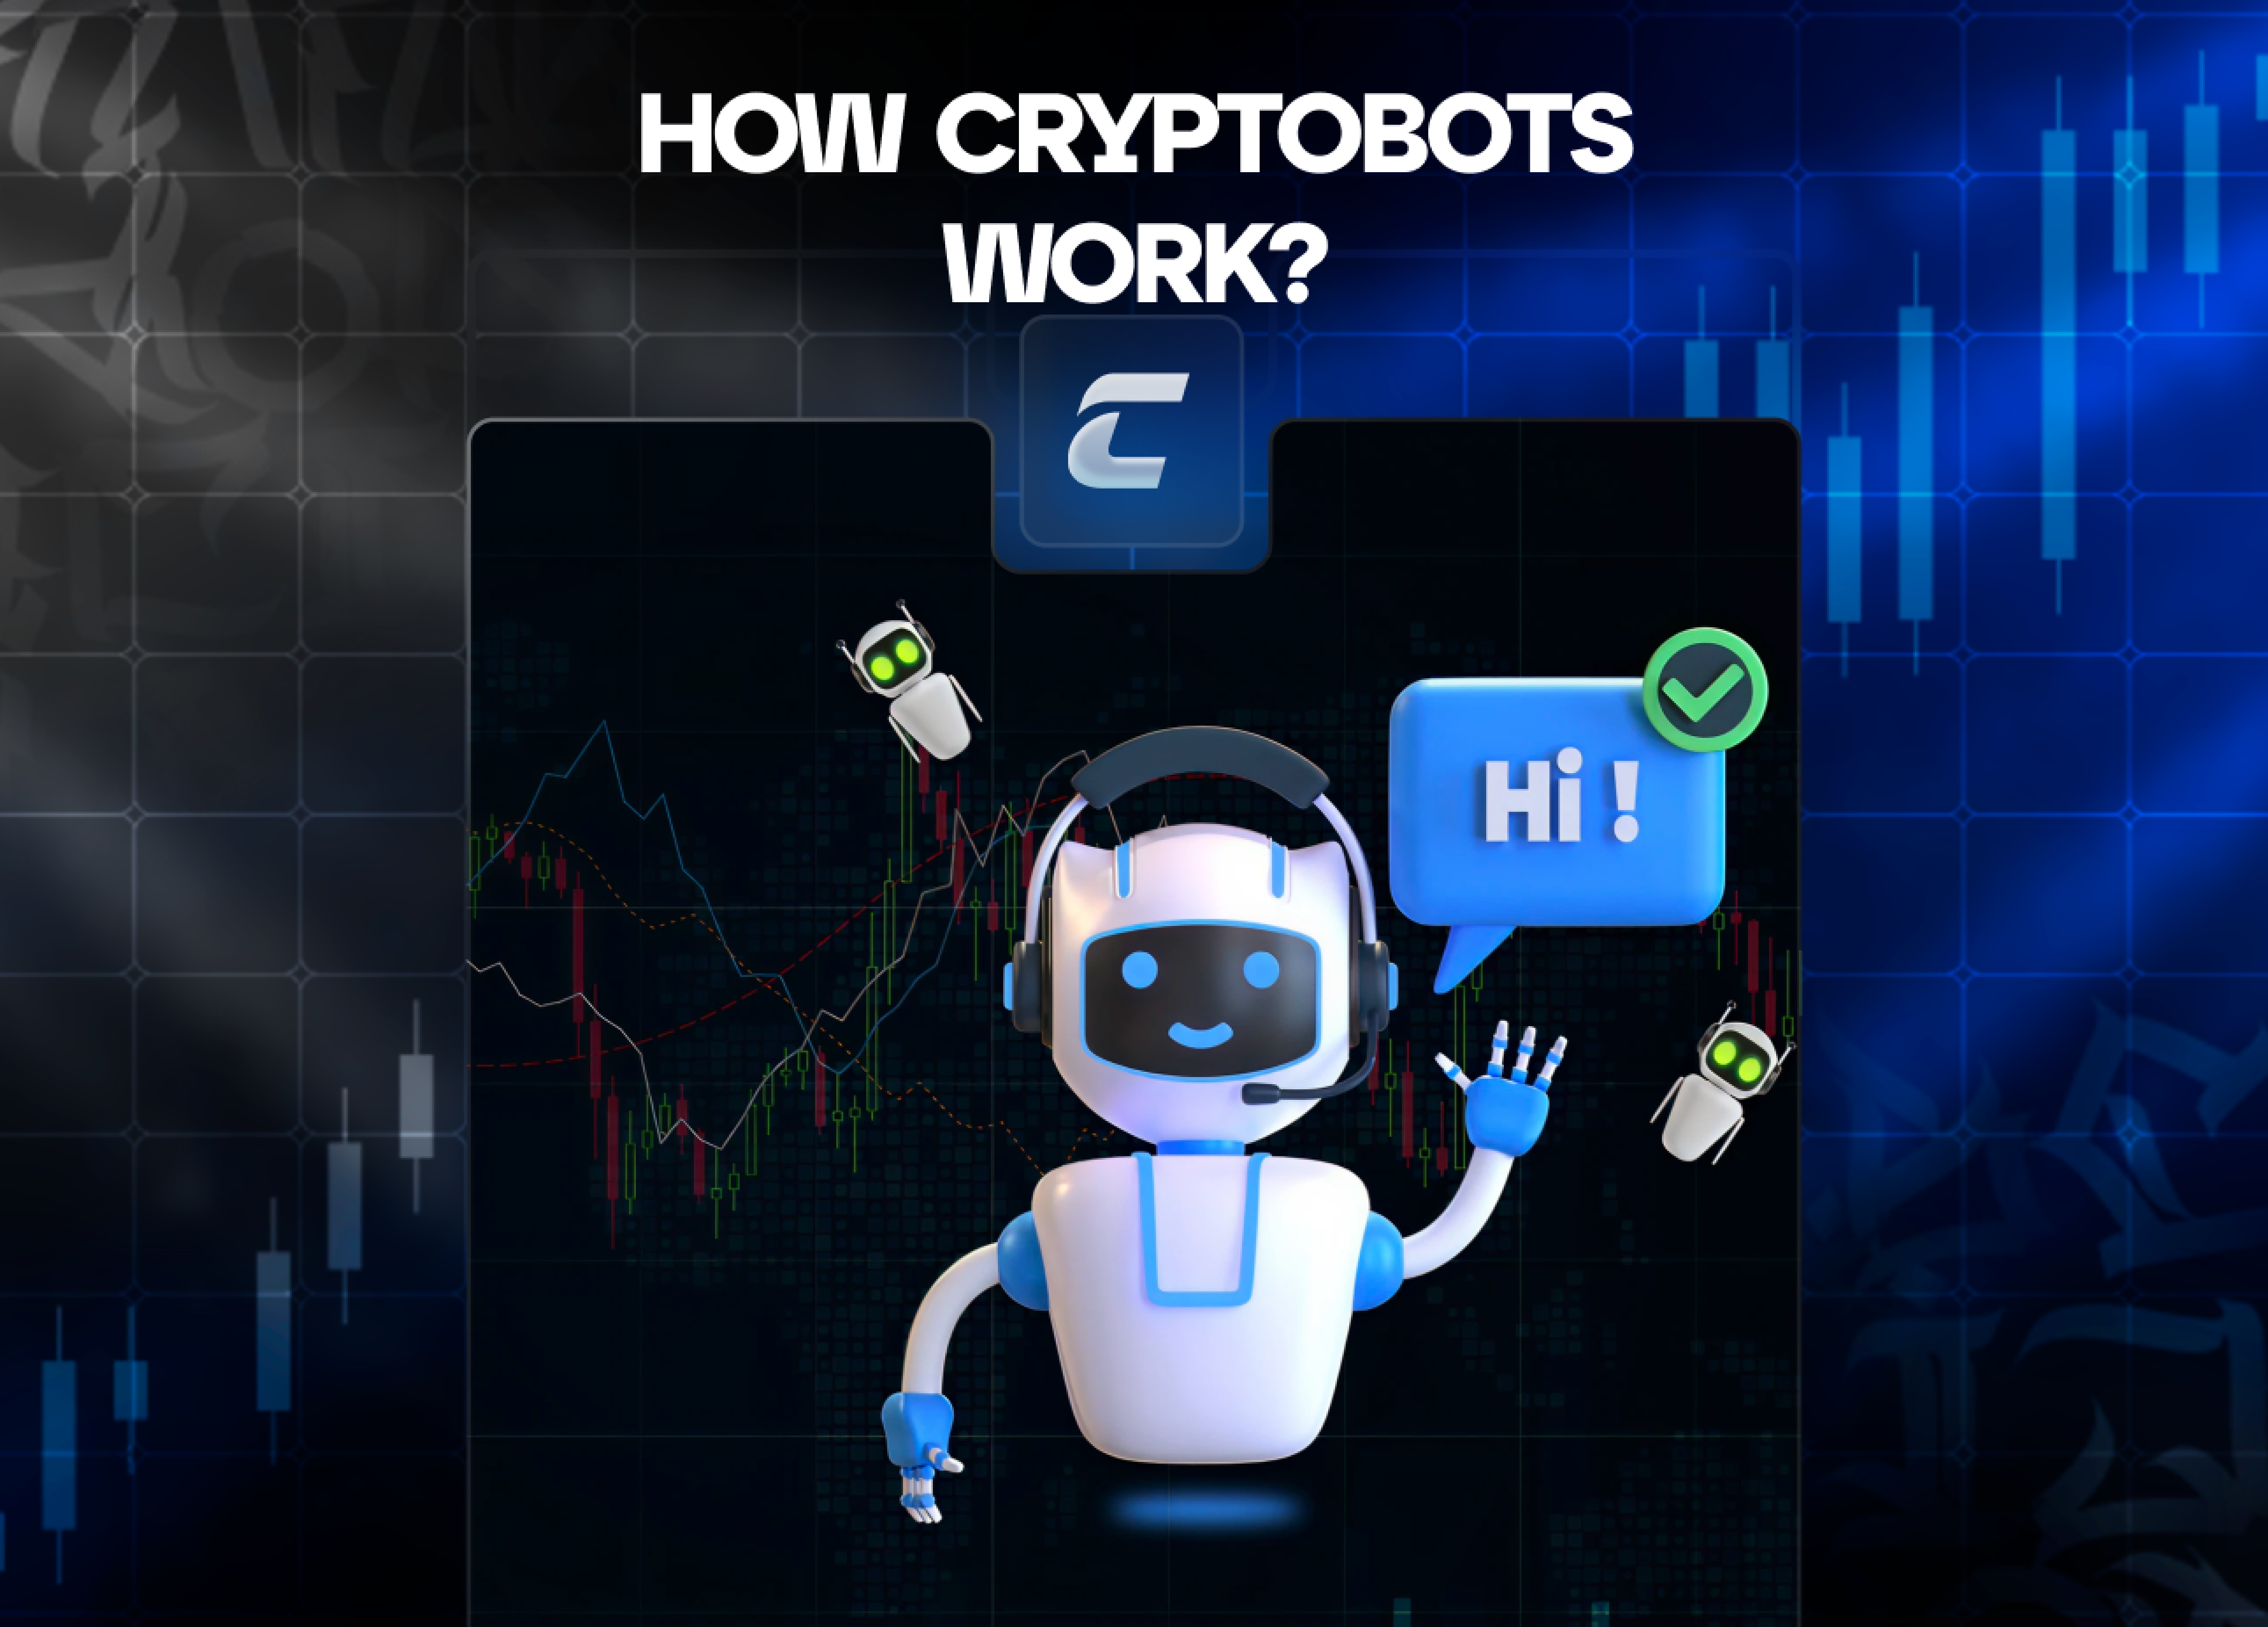
Крипто робот - типы и как на них зарабатывать
Можно ли совмещать торговлю и основную работу
Что такое AI-агенты в криптовалюте?
Индикаторы технического анализа: назначение и роль в трейдинге
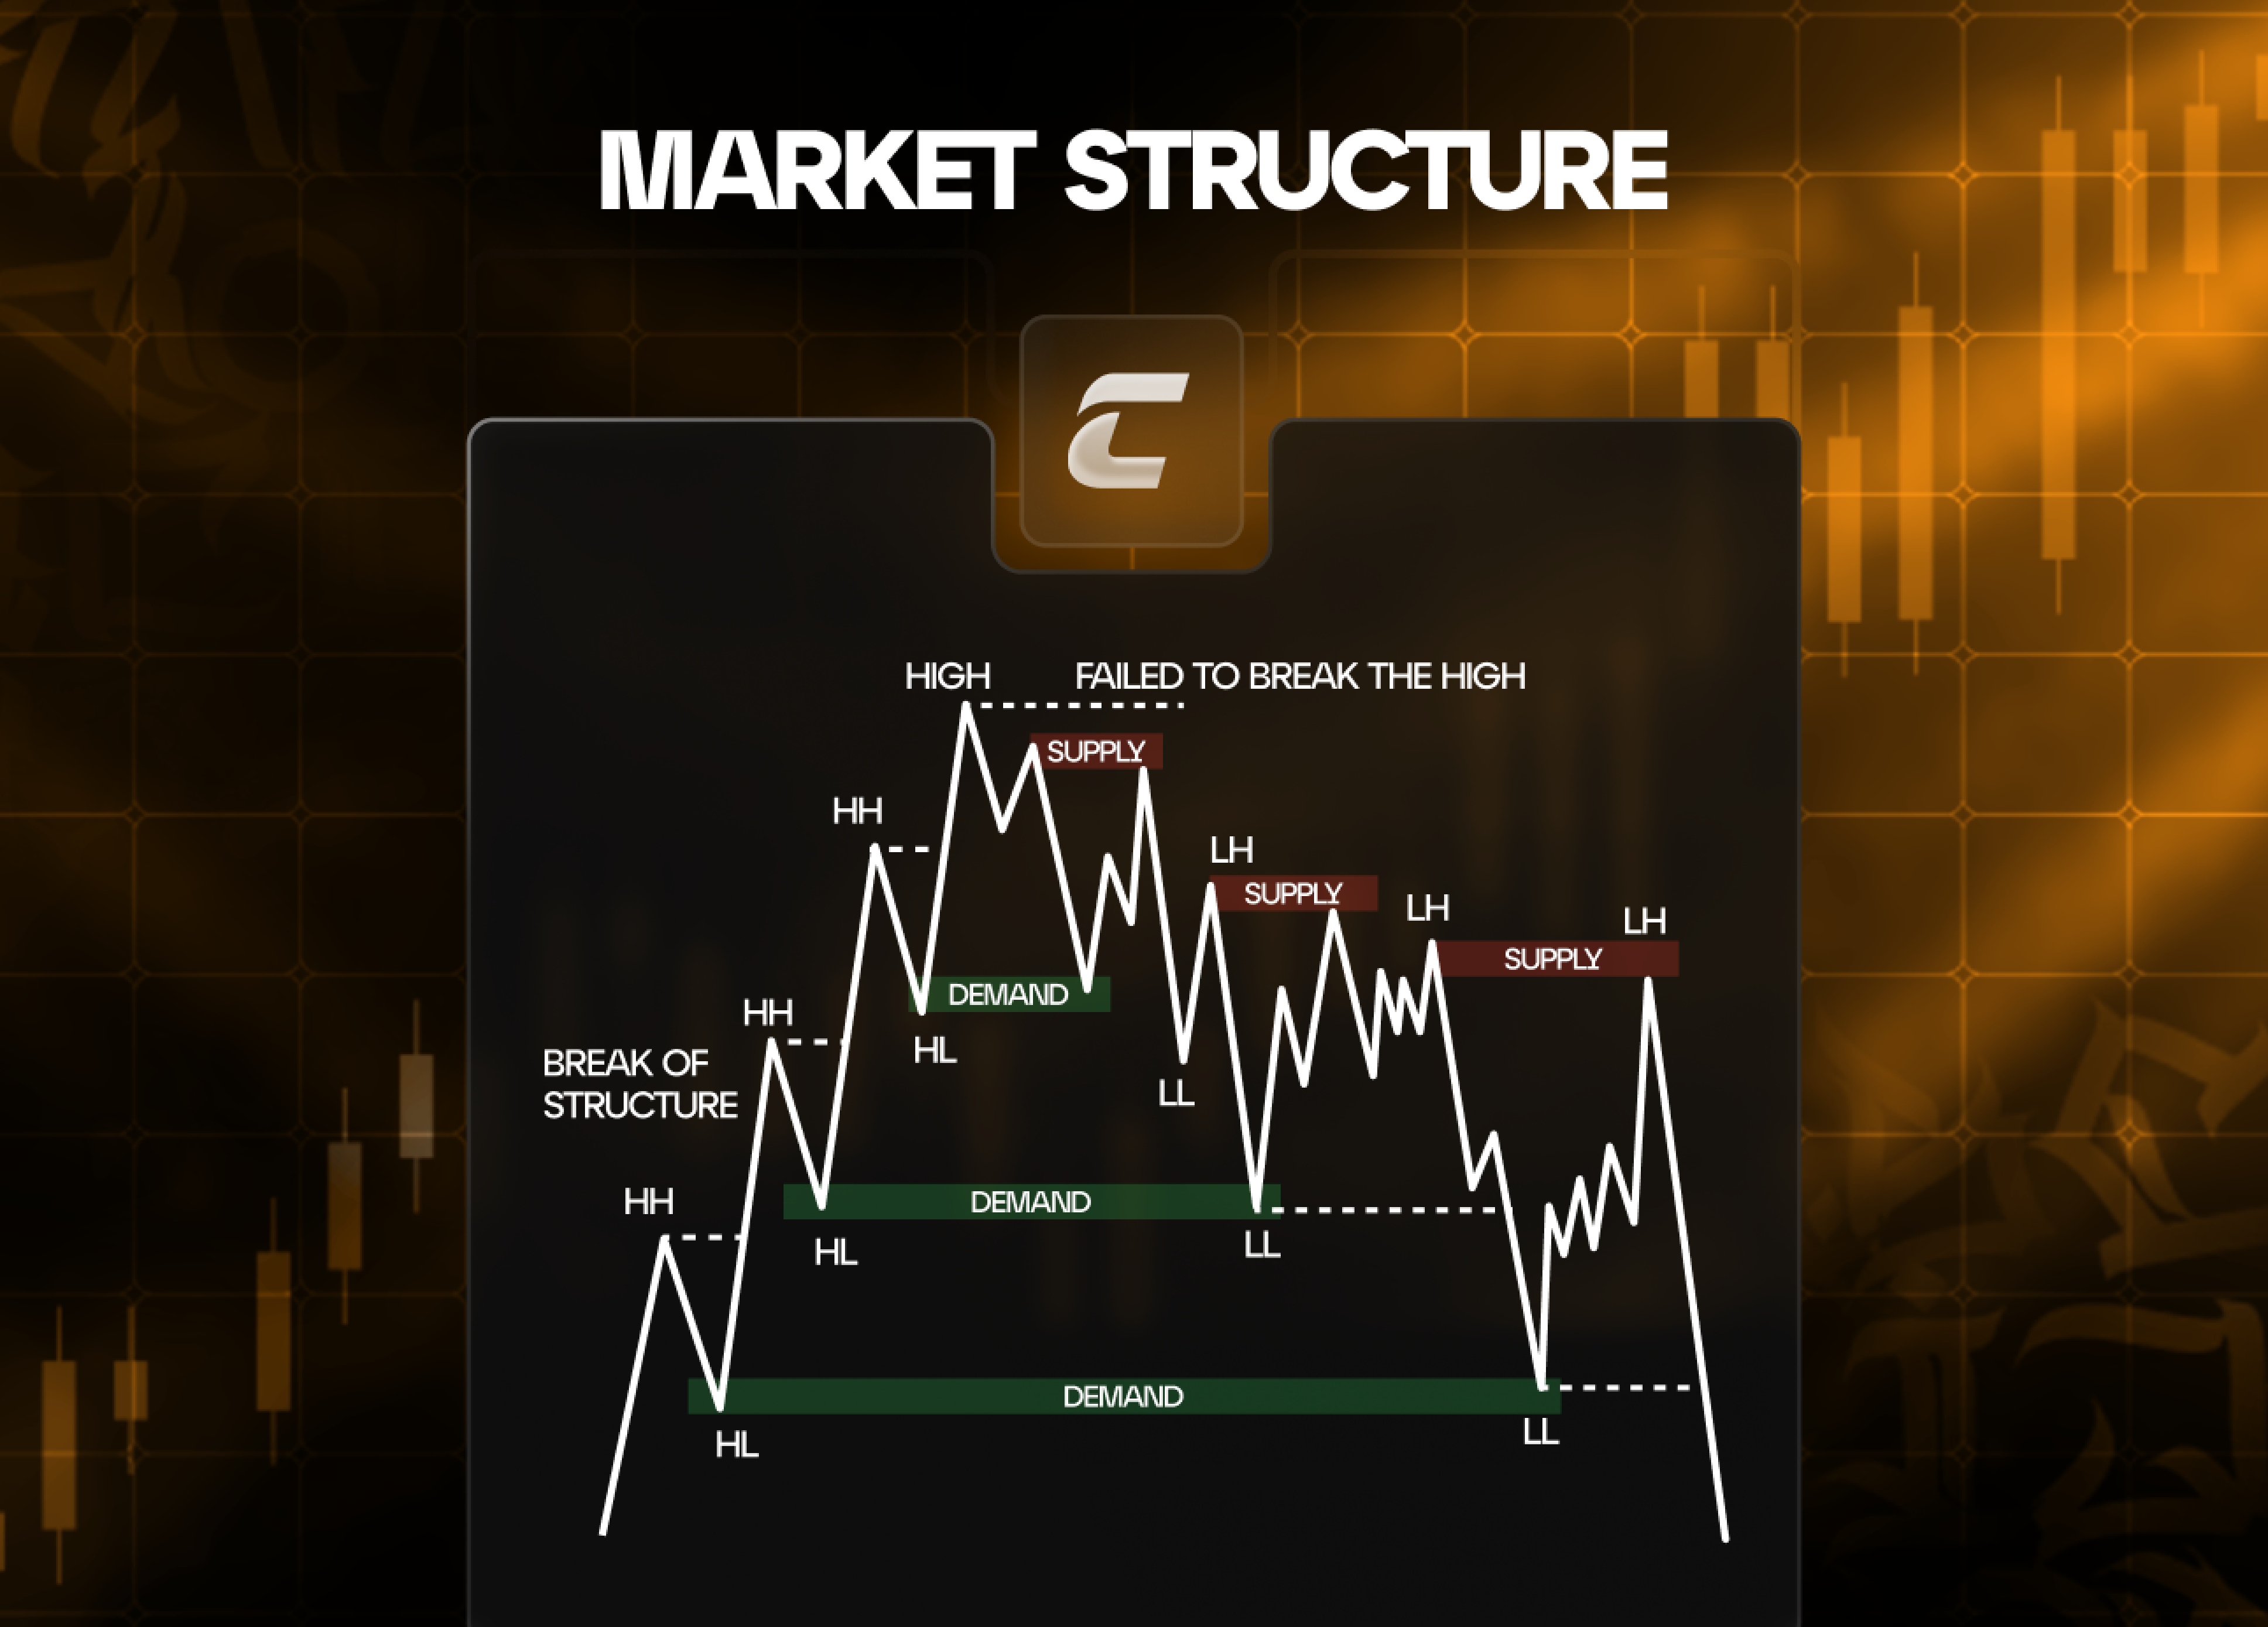
Рыночная структура