Weekly Plan - 19.08 - 23.08.2024
Macro
👀 Main market events in the coming week:
Monday - 19.08
🇩🇪 12m T-Bill - 12:30pm
🇬🇧 Rightmove House Price Index - 18:06
🇺🇸 3m-6m T-bills - 18:30
Tuesday - 20.08
🇩🇪 PPI - 09:00
🇪🇺 Current Account - 11:00
🇪🇺 Final CPI - 12:00
🇪🇺 Final Core CPI - 12:00 pm
🇺🇸 Bostic (FOMC) - 20:15
🇺🇸 Weekly Crude Oil Stock - 23:30
Wednesday - 21.08
🇬🇧 Public Sector Net Borrowing - 09:00 AM
🇬🇧 Public Sector Net Cash Requirement - 09:00
🇨🇭 M3 Supply - 10:00
🇬🇧 3y T-Gilt - 12:00.
🇩🇪 10y T-Bund - 12:30 pm
🇺🇸 Mortgage Market Index - 14:00
🇺🇸 MBA 30-Year Mortgage Rate - 14:00
🇺🇸 MBA Purchase Index - 14:00
🇺🇸 Cushing + Crude Oil Inventories - 17:30
🇺🇸 20y T-Bond - 20:00
🇺🇸 Meeting Minutes (FOMC) - 21:00
Thursday - 22.08
🇫🇷 Manufacturing/Services PMI - 10:15 am
🇩🇪 Manufacturing/Services PMI - 10:30 AM
🇪🇺 Manufacturing/Services PMI - 11:00 AM
🇬🇧 Manufacturing/Services PMI - 11:30 AM
🇪🇺 Monetary Policy Meeting - 14:30
🇺🇸 Unemployment Claims - 15:30
🇺🇸 S&P Global Manufacturing PMI (Prelim) - 4:45 pm
🇺🇸 S&P Global Services PMI (Prelim) - 16:45
🇺🇸 Existing Home Sales - 5:00 p.m.
🇺🇸 4w-8w T-bill - 6:30 p.m.
Friday - 11/23/2018
🇬🇧 Distributive Trades Survey - 1:00 p.m.
🇺🇸 Building Permits - 3:30 p.m.
🇺🇸 New Home Sales - 5:00 p.m.
🇬🇧 Baili (Bank of England) - 22:00
🗂️ CFTC Report - 22:30
Let's take a look at the most important ones:
Monday
There is no significant news on Monday that causes increased volatility in the market.
Tuesday
🇩🇪 PPI - 09:00
Previous MoM (0.2% ) YoY (-1.6%)
Forecast MoM (0.1%) YoY (-1.6%)
PPI (Producer Price Index) - Pro ducer Price Index, reflects changes in the prices of goods and services from the point of view of their producers and sellers. This index covers a wide range of industries, including raw materials, materials and intermediate products. PPI has a lagged effect on measures of consumer inflation because changes in the prices of raw materials and intermediate goods are not immediately reflected in prices for final consumers. For example, an increase in metal prices may not immediately affect the price of a car at a car dealership, but over time this increased cost may be passed on to the consumer. It is important to note that PPI takes into account not only goods but also services, making it a comprehensive measure of price changes throughout the economy. This provides a more complete picture of economic processes and potential inflationary pressures.
How does the PPI score on price dynamics? A rise in values will be an incentive to tighten monetary policy and the corresponding strengthening of the currency.
🇪🇺 Current Account - 11:00
Previous reading (36.7B)
MoM Forecast (37.0B)
Current Account reflects the overall state of a country's foreign economic activity. It measures the difference between the value of exported and imported goods, services, and also takes into account interest payments for a certain period of time, usually a quarter.
The Current Account structure includes several components:
- Trade Balance: this is the difference between exports and imports of goods. This part of the indicator is the same as the monthly trade balance indicator.
- Services Balance: accounts for exports and imports of services such as tourism, transportation, financial services, and the like.
- Primary income: includes investment income, interest, dividends, and wages and salaries received from or paid abroad.
- Secondary Income: covers unilateral transfers such as workers' remittances, international aid, etc.
The importance of Current Account to the foreign exchange market is that it reflects the demand for the national currency. When a country has a positive Current Account (surplus), it means that foreigners buy more of that country's goods and services than it buys from them. To make these purchases, foreigners need to purchase the national currency of the exporting country.
Thus, a positive current account can lead to an appreciation of the domestic currency as demand for it increases. Conversely, a negative current account (deficit) can put pressure on the national currency as the country requires more foreign currency to pay for imports.
🇪🇺 Final CPI - 12:00
Previous MoM (0.2%) YoY (2.5%)
Forecast MoM (0.0%) YoY (2.6%)
MoM
YoY
🇪🇺 Final Core CPI - 12:00 PM
Previous MoM (0.4% ) YoY (2.9%)
Forecast MoM (-0.2% ) YoY (2.9%)
🇺🇸 Bostic (FOMC) - 8:15 p.m.
Federal Reserve Bank of Atlanta President Raphael Bostic plays an important role in shaping expectations for future US monetary policy. His public speeches are often perceived as indicators of possible moves by the Federal Reserve. In his rhetoric, Bostic often uses careful and carefully measured language to hint at changes in interest rates, inflation forecasts, or other key economic parameters. Thus, Bostic, even without making direct statements, is able to influence market participants' expectations, which makes his words important for predicting the Fed's future moves.
Wednesday
🇬🇧 3y T-Gilt - 12:00 p.m.
🇩🇪 10y T-Bund - 12:30 pm
🇺🇸 20y T-Bond - 20:00
The yield on auctioned government bonds reflects the return an investor will receive by holding the bond to maturity. Governments issue these obligations to cover budget deficits and refinance debt. The average yield at auction is important for assessing the health of the economy and the level of confidence in the government.
Fluctuations in yields can indicate changes in the economy and investor expectations. If yields are rising compared to previous auctions, it may indicate a decline in confidence or expectations of rising interest rates and a strengthening currency.
🇺🇸 Meeting Minutes (FOMC) - 21:00
The FOMC Minutes are a comprehensive record of the meetings of the Federal Open Market Committee (FOMC), which sets the key directions for US monetary policy. These documents are published three weeks after each meeting and detail the discussions that take place among the committee members. The minutes reflect the views and arguments of all participants on issues related to interest rate management, inflation, employment and other economic indicators. They provide a deeper understanding of how decisions to change or maintain current monetary policy are shaped, as well as provide investors and analysts with a more complete picture of future economic directions.
Thursday
🇫🇷 Manufacturing/Services PMI - 10:15 a.m.
🇩🇪 Manufacturing/Services PMI - 10:30 a.m.
🇪🇺 Manufacturing/Services PMI - 11:00 a.m.
Previous Manufacturing (45.8); Services (51.9)
Forecast Manufacturing (46.1); Services (52.2)
Manufacturing
Services
🇬🇧 Manufacturing/Services PMI - 11:30 am
Previous Manufacturing (52.1); Services (52.5)
Forecast Manufacturing (52.2); Services (52.7)
Manufacturing
Services
ThePurchasing Managers Index (PMI) is a business activity index that is one of the key indicators of a country's economic health. The PMI is calculated based on surveys of purchasing managers who assess the current conditions and outlook for their businesses. These surveys cover aspects such as output, new orders, inventories of goods, employment and shipments. A PMI above 50 indicates economic growth and expansion of business activity (currency appreciation). If the index is above 48 for an extended period of time, it may also indicate that the economy is still growing, albeit at a lower intensity. A reading below 48 indicates a contraction in business activity.
PMI Services - reflects business activity in the services sector. It is based on surveys of companies operating in service industries such as transportation, communications, finance, health care and education. This index provides an indication of the state and prospects of the services sector, which in most developed economies accounts for a significant portion of GDP.
PMI Manufacturing - measures business activity in the manufacturing sector. It is formed on the basis of surveys of representatives of manufacturing companies, which assess such parameters as production volumes, the number of new orders, employment levels and inventories. PMI Manufacturing is an important indicator of the health of the manufacturing industry, which plays a key role in the economy, especially in countries with developed industrial sectors.
🇺🇸 Unemployment Claims/Initial Jobless Claims - 3:30 PM
Previous figure (227K)
Forecast (233K)
Initial Jobless Claims (IJC), or unemployment claims, is a weekly report published by the U.S. Department of Labor (Department of Labor). This report records the number of Initial Jobless Claims filed during the previous week. The IJC report gives an idea of how many people first applied for unemployment assistance, which can indicate possible changes in the labor market. For example, a surge in applications may indicate the beginning of economic difficulties, such as a decline in business activity or a wave of layoffs. Conversely, a decline in applications is often interpreted as a sign that the labor market is improving and employment is rising.
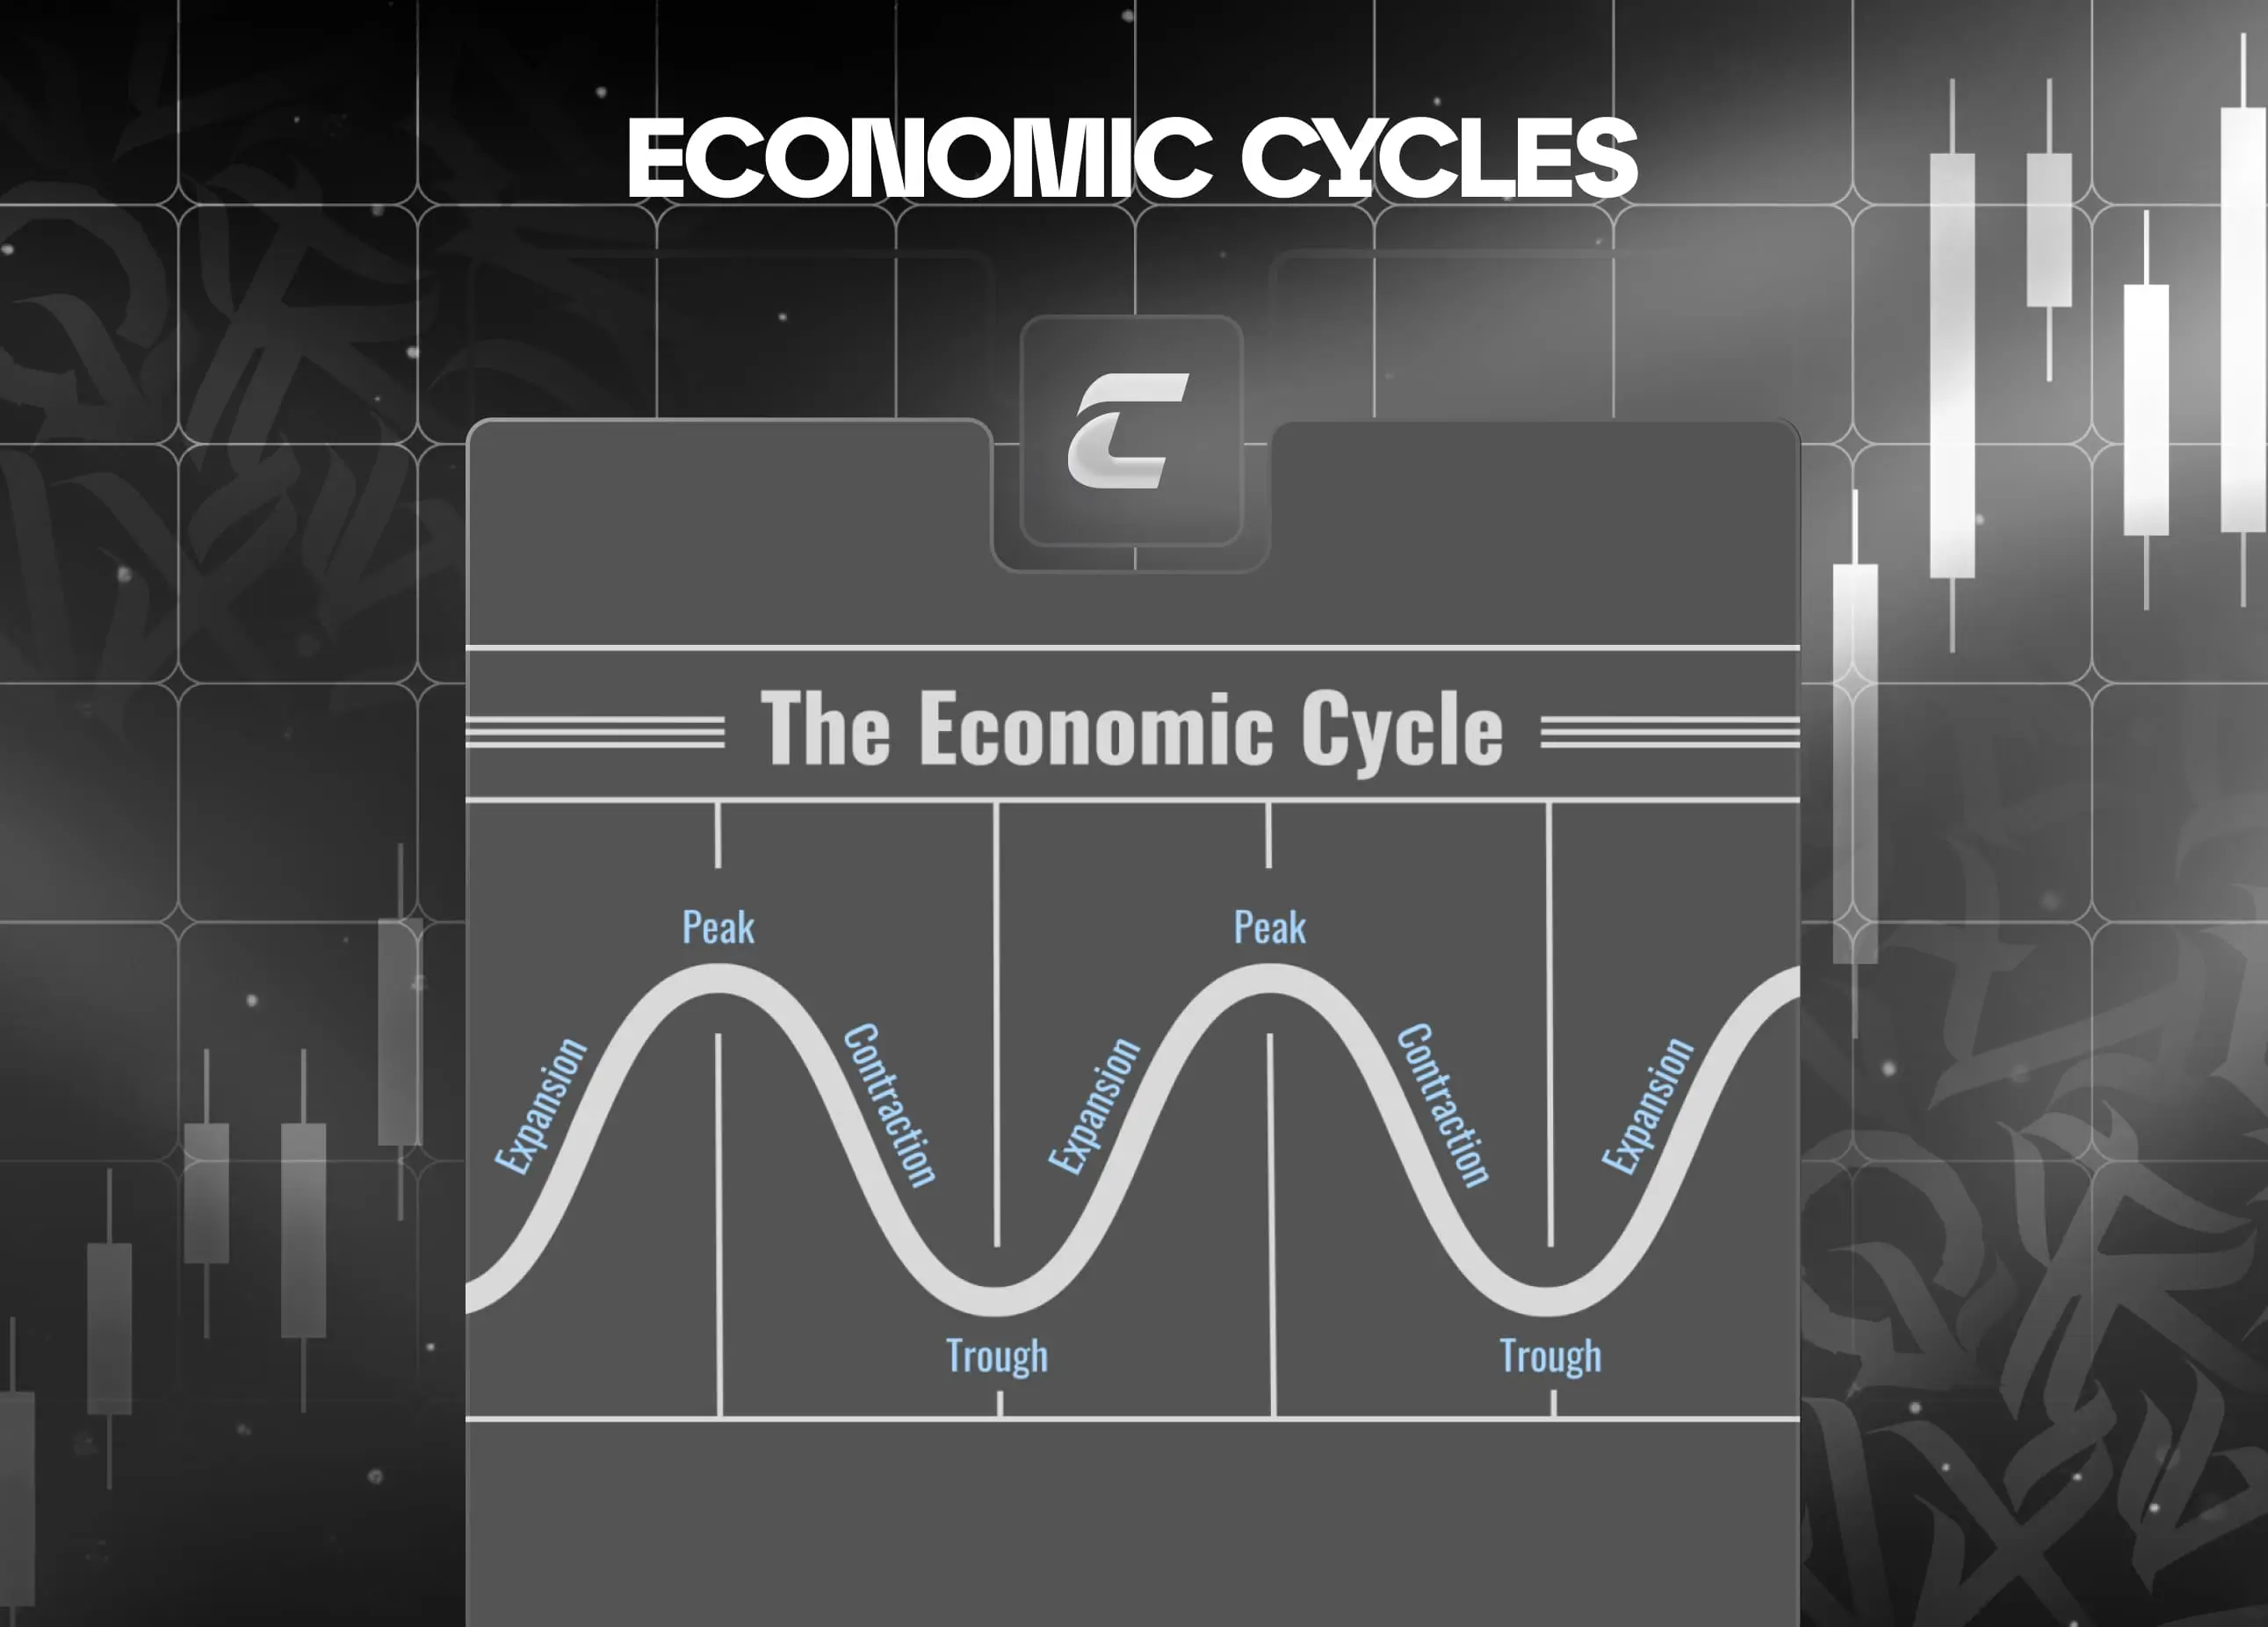
This indicator is also a leading indicator of the economic cycle, as it allows us to gauge the current state of the economy before more comprehensive data such as employment or GDP reports are released. However, it is worth noting that Initial Jobless Claims may be subject to significant revisions, as the data may be adjusted in subsequent reports based on more complete information.
In addition, this indicator is sometimes subject to manipulation, especially during periods of economic uncertainty. This may be due to temporary factors such as seasonal fluctuations or government programs that may distort the data in the short term.
A decline in the indicators could indicate a possible rise in inflation, which in turn would lead to tighter monetary policy and a stronger currency.
🇺🇸 S&P Global Manufacturing PMI (Prelim) - 4:45 p.m.
Previous reading (49.6)
Forecast (49.8)
The S&P Global reading from S&P Global has less impact and is considered not as accurate as the one from ISM.
🇺🇸 S&P Global Services PMI (Prelim) - 4:45 p.m.
Previous reading (55.0)
Forecast (54.0)
The S&P Global reading from S&P Global has less influence and is considered not as accurate as that from ISM.
Friday
🗂️ CFTC Report - 22:30
TheCommitment of Traders (COT) Report is an important weekly report that provides detailed information on the aggregate futures positions of various categories of market participants on U.S. exchanges. It is published every Friday at 22:30 GMT+3 by the Commodity Futures Trading Commission (CFTC). This report serves as a snapshot of the market, showing the distribution of positions between large institutional investors, commercial participants and retail traders. This analysis helps you as traders and analysts to understand market sentiment, identify possible trends and predict future price movements based on how different groups of market participants allocate their positions.
Crypto
BTC/USDT
Monthly
https://www.tradingview.com/x/yKSEeL8a/
The situation has not changed, I am still waiting for the close of the month to see the consolidation of strength for bitcoin and the pairs that are trading towards it.
Weekly
https://www.tradingview.com/x/Jm8wCzx7/
There is nothing of interest for the weekly period. Any weekly close will have no impact whatsoever, we will still be in consolidation in the market as it is, however bitcoin may get distribution a little earlier.
Daily
https://www.tradingview.com/x/sdmy5HMz/
The plan for the daily context has not changed in any way, I am waiting for an exit either now or through a decline to the nearest level.
ETH/USDT.
Monthly
https://www.tradingview.com/x/TO27bX0h/
The situation here is more complicated than with bitcoin. We don't have a perfect close yet, and if it doesn't go above the last low it will be a step down in price, but it could all be a hoax and we could get a takeover in September.
Weekly
https://www.tradingview.com/x/ZsPDARLs/
For weekly I am waiting for a correction into the zone of interest or a break. To me this is the perfect turn of events.
Daily
https://www.tradingview.com/x/2qvQjf3w/
As you can see everything is similar here.
ETH/BTC
Weekly
https://www.tradingview.com/x/xXcZm4Zk/
Weeks of consolidation await us. Who said that a bull market is so easy? You have to wait a long, long time.
FX & Stock market
DXY
Weekly
https://www.tradingview.com/x/E4D7NXJh/
Last week did not form any narrative and was in a sideways movement inside the first week of August (inside bar). This means that the high and low of the first week of August are key points for the current consolidation.
Daily
https://www.tradingview.com/x/DONuPfwh/
Since last week did nothing the plan remains the same. It is advised to work from Range Low / Range High levels with support zones 103.6 above and FVG BISI below.
EURUSD
Weekly
https://www.tradingview.com/x/9u5GjgEW/
As expected last week the ascending Order Flow was not broken and the price reached the main global target in the form of the maximum of the global consolidation at a major price level - 1.10. At the moment it would be logical to consider a potential correction.
Daily
https://www.tradingview.com/x/zXEaLFmK/
At the current moment we see that EURUSD has formed an SMT with the DXY index, by taking out last week's high, which DXY did not. This may be a sign of a downward correction formation, but to confirm this logic - it is necessary to break the level of 1.0952, which is currently a support for the price. In case SMT is disabled and there will be no reversal, the target for longing will be External BSL at 1.1140.
GBPUSD
Weekly
https://www.tradingview.com/x/Bw3uS4L7/
GBPUSD did not consolidate below, but showed quite an impulsive growth in contrast to our expectations last week. This could be a sign of continued upward movement to the External BSL level (1.3142). However, the SMT with EURUSD at 1.3044 is still active and is a sign of a downtrend.
Daily
https://www.tradingview.com/x/Mtyngn90/
On the daily timeframe the support zone for the price was +OB, we assume that this SMT can be invalidated and the pound will reach these price levels.
SP500 / NQ100
Weekly
https://www.tradingview.com/x/XopSVPlY/
Last week we mentioned that a new upward narrative has started and that the passage of 5432 (SP500) and 19000 (NQ100) levels will confirm the indices' move to renew ATH. For now, the primary target for SP500 is External BSL at 5721 while for NQ100 the primary target is FVG SIBI at 20,000.
Daily
https://www.tradingview.com/x/y2lArOeM/
From a daily timeframe perspective, both indices are near the trouble zone of Internal BSL at 5600 (SP500) and 19720 (NQ100), removal of these levels could lead to a short-term downside move to FVG BISI or Balanced zones for both indices.
In general, the narrative is upward, so we advise to work in continuation on the upward Order Flow.