The S&P 500 is the premier stock market index
What is the S&P 500?
The S&P 500, or Standard & Poor's 500, is an index that reflects the performance of the 504 largest publicly traded companies listed on the U.S. stock exchanges (NYSE and NASDAQ).
This index is one of the most widely used metrics for assessing the overall health of the U.S. stock market.
The S&P 500 includes companies from 10 economic sectors:
- Information Technology: the Information Technology index combines stocks of companies involved in developing communications and other electronic equipment, manufacturing devices and components, providing IT services, creating semiconductors and software, as well as storage systems and more. Top contributors to this index include Apple, Microsoft, Alphabet, Adobe, Intel, Cisco, and Visa.
- Healthcare: The Healthcare index includes pharmaceutical companies, medical clinics, medical device and service manufacturers, and biotechnology companies. Notable participants in this index include companies such as Pfizer, Bristol-Myers Squibb, and UnitedHealth.
- Financials: The index includes companies from banking, insurance, investment funds and other financial institutions. The index includes stocks such as JPMorgan Chase, Goldman Sachs and Bank of America.
- Communications & Telecommunications: The Telecom Services Index includes stocks of leading companies in this industry such as AT&T, Verizon, Facebook, Activision Blizzard, Disney and Netflix.
- Industrials: the Industrials Index combines stocks of companies from fourteen different industries, including transportation, defense, electrical, and trade. The top industrial companies represented in this index include Lockheed Martin, Boeing, Caterpillar, Delta Air Lines, General Electric, and FedEx.
- Consumer Staples: The Consumer Staples Index consists primarily of consumer staples companies as well as major retailers. Representatives of this index include corporations such as Procter & Gamble, Coca-Cola, Costco, and Kroger.
- Non-core consumer goods: the index combines companies that mainly specialize in the production of durable goods. It includes stocks such as Amazon, General Motors, Hilton, Booking, Nike, McDonald's and Home Depot.
- Energy: The index includes two key sectors: 1) energy equipment and services, and 2) oil, gas and fuels. It includes stocks of leading companies such as Exxon Mobil, Chevron and Halliburton.
- Materials: the Chemicals, Construction, Metalworking and Other Primary Materials companies index includes stocks of companies such as Dow, Dupont, Ecolab and International Paper.
- Real Estate: The Real Estate Index covers stocks of investment funds specializing in real estate, as well as companies engaged in real estate management and development. Among the stocks represented in this index are companies such as American Tower, Simon Property Group and Prologis.
Sectors that make up the S&P 500 4
The S&P 500 Index is created with the input of an index committee of Standard & Poor's analysts and economists.
Standard & Poor's also maintains other important indices, such as the S&P 600, which includes small companies with market capitalizations between $300 million and $2 billion, and the S&P 400, which covers mid-sized companies with market capitalizations between $2 billion and $10 billion.
History of the S&P 500: How the index has changed
In 1860, Henry Varnum Poor established Poor's Publishing, which published an investor's guide to the railroad industry. In 1923, Standard Statistics, founded in 1906, began valuing mortgage bonds and developed its first stock market index. This index included stocks of 233 U.S. companies and was calculated weekly.
In 1926, a daily calculated index of 90 stocks from this company was created, but as the economy and stock market grew, it became apparent that a more representative index that would cover a wider range of companies was needed.
In 1957, Standard & Poor's, founded in 1941 by the merger of Standard Statistics Company and Poor's Publishing, created the S&P 500 Index as an extension of the S&P 90 Index.
The following companies were the first to be listed in the S&P 500:
- Coca-Cola is one of the oldest companies in the S&P 500 Index. The company was included in the index in 1957, when it had a market capitalization of about $2 billion. By 2023, its market capitalization exceeded $200 billion. Coca-Cola continues to be included in the index to this day.
- General Electric is an American diversified corporation that manufactures and sells electrical equipment, aircraft engines, medical equipment, and other products and services. The company was founded in 1892 by Thomas Edison. General Electric was delisted from the S&P 500 index in 2023. The company was split into three independent companies, GE Healthcare, GE Power and GE Renewable Energy.
- Procter & Gamble is an American multinational corporation that manufactures and markets consumer products such as cleaning products, personal care products, and food products. The company was founded in 1837 by William Procter and James Hannibal Pemberton. Procter & Gamble was included in the S&P 500 Index in 1957 and continues to be included in the index to this day.
- International Business Machines is an American diversified corporation that manufactures and sells computer hardware, software, and other products and services. The company was founded in 1911 by Charles Flint. International Business Machines was included in the S&P 500 index in 1957 and continues to be included in the index to this day.
- General Motors is an American automobile company that manufactures and sells cars, trucks, and other vehicles. The company was founded in 1908 by William Durant. General Motors continues to be a part of the index to this day.
These companies represented a wide range of industries including energy, manufacturing, consumer products, and technology. Many of these companies are still leading players in the U.S. stock market.
In the early years of the index, Exxon, Ford Motor Company, IBM, JPMorgan Chase, Pfizer, and many other world-renowned companies were also listed.
On August 31, 1976, the Vanguard Group made a proposal to launch the world's first mutual fund designed for ordinary investors that tracked an index. On April 21, 1982, the Chicago Mercantile Exchange (CME) began trading futures linked to the index. The index slowly began to enter the lives of investors and traders and on July 1, 1983, the Chicago Board Options Exchange began trading options linked to the index. In January 1993, the SPDR S&P 500 ETF (SPY) was launched by State Street Corporation. The index continued to evolve and as early as September 1997, CME Group introduced a new futures contract, the S&P E-mini.
Throughout its existence until 2005, the S&P 500 Index was weighted by the market capitalization of all company shares, including shares that were not publicly traded. This meant that companies with more shares in the hands of investors had a higher weighting in the index than companies with fewer free-floating shares.
In 2005, the index switched to a capitalization-adjusted free float weighting. This means that the index now only takes into account stocks that can be freely bought and sold on the open market. This change made the index a more accurate reflection of the real value of companies, as it only takes into account stocks that can actually be used for investment.
To understand how this affects the index, consider an example: suppose there are two companies, A and B. Company A has a market capitalization of $100 billion and all of its shares are publicly traded. Company B also has a market capitalization of $100 billion, but only half of its stock is publicly traded. Before 2005, both companies would have the same weight in the S&P 500 index. After 2005, Company A would have a greater weight in the index because 100% of its stock was publicly traded. This change was implemented to make the S&P 500 index a more accurate reflection of the real value of companies and to make it more useful to investors.
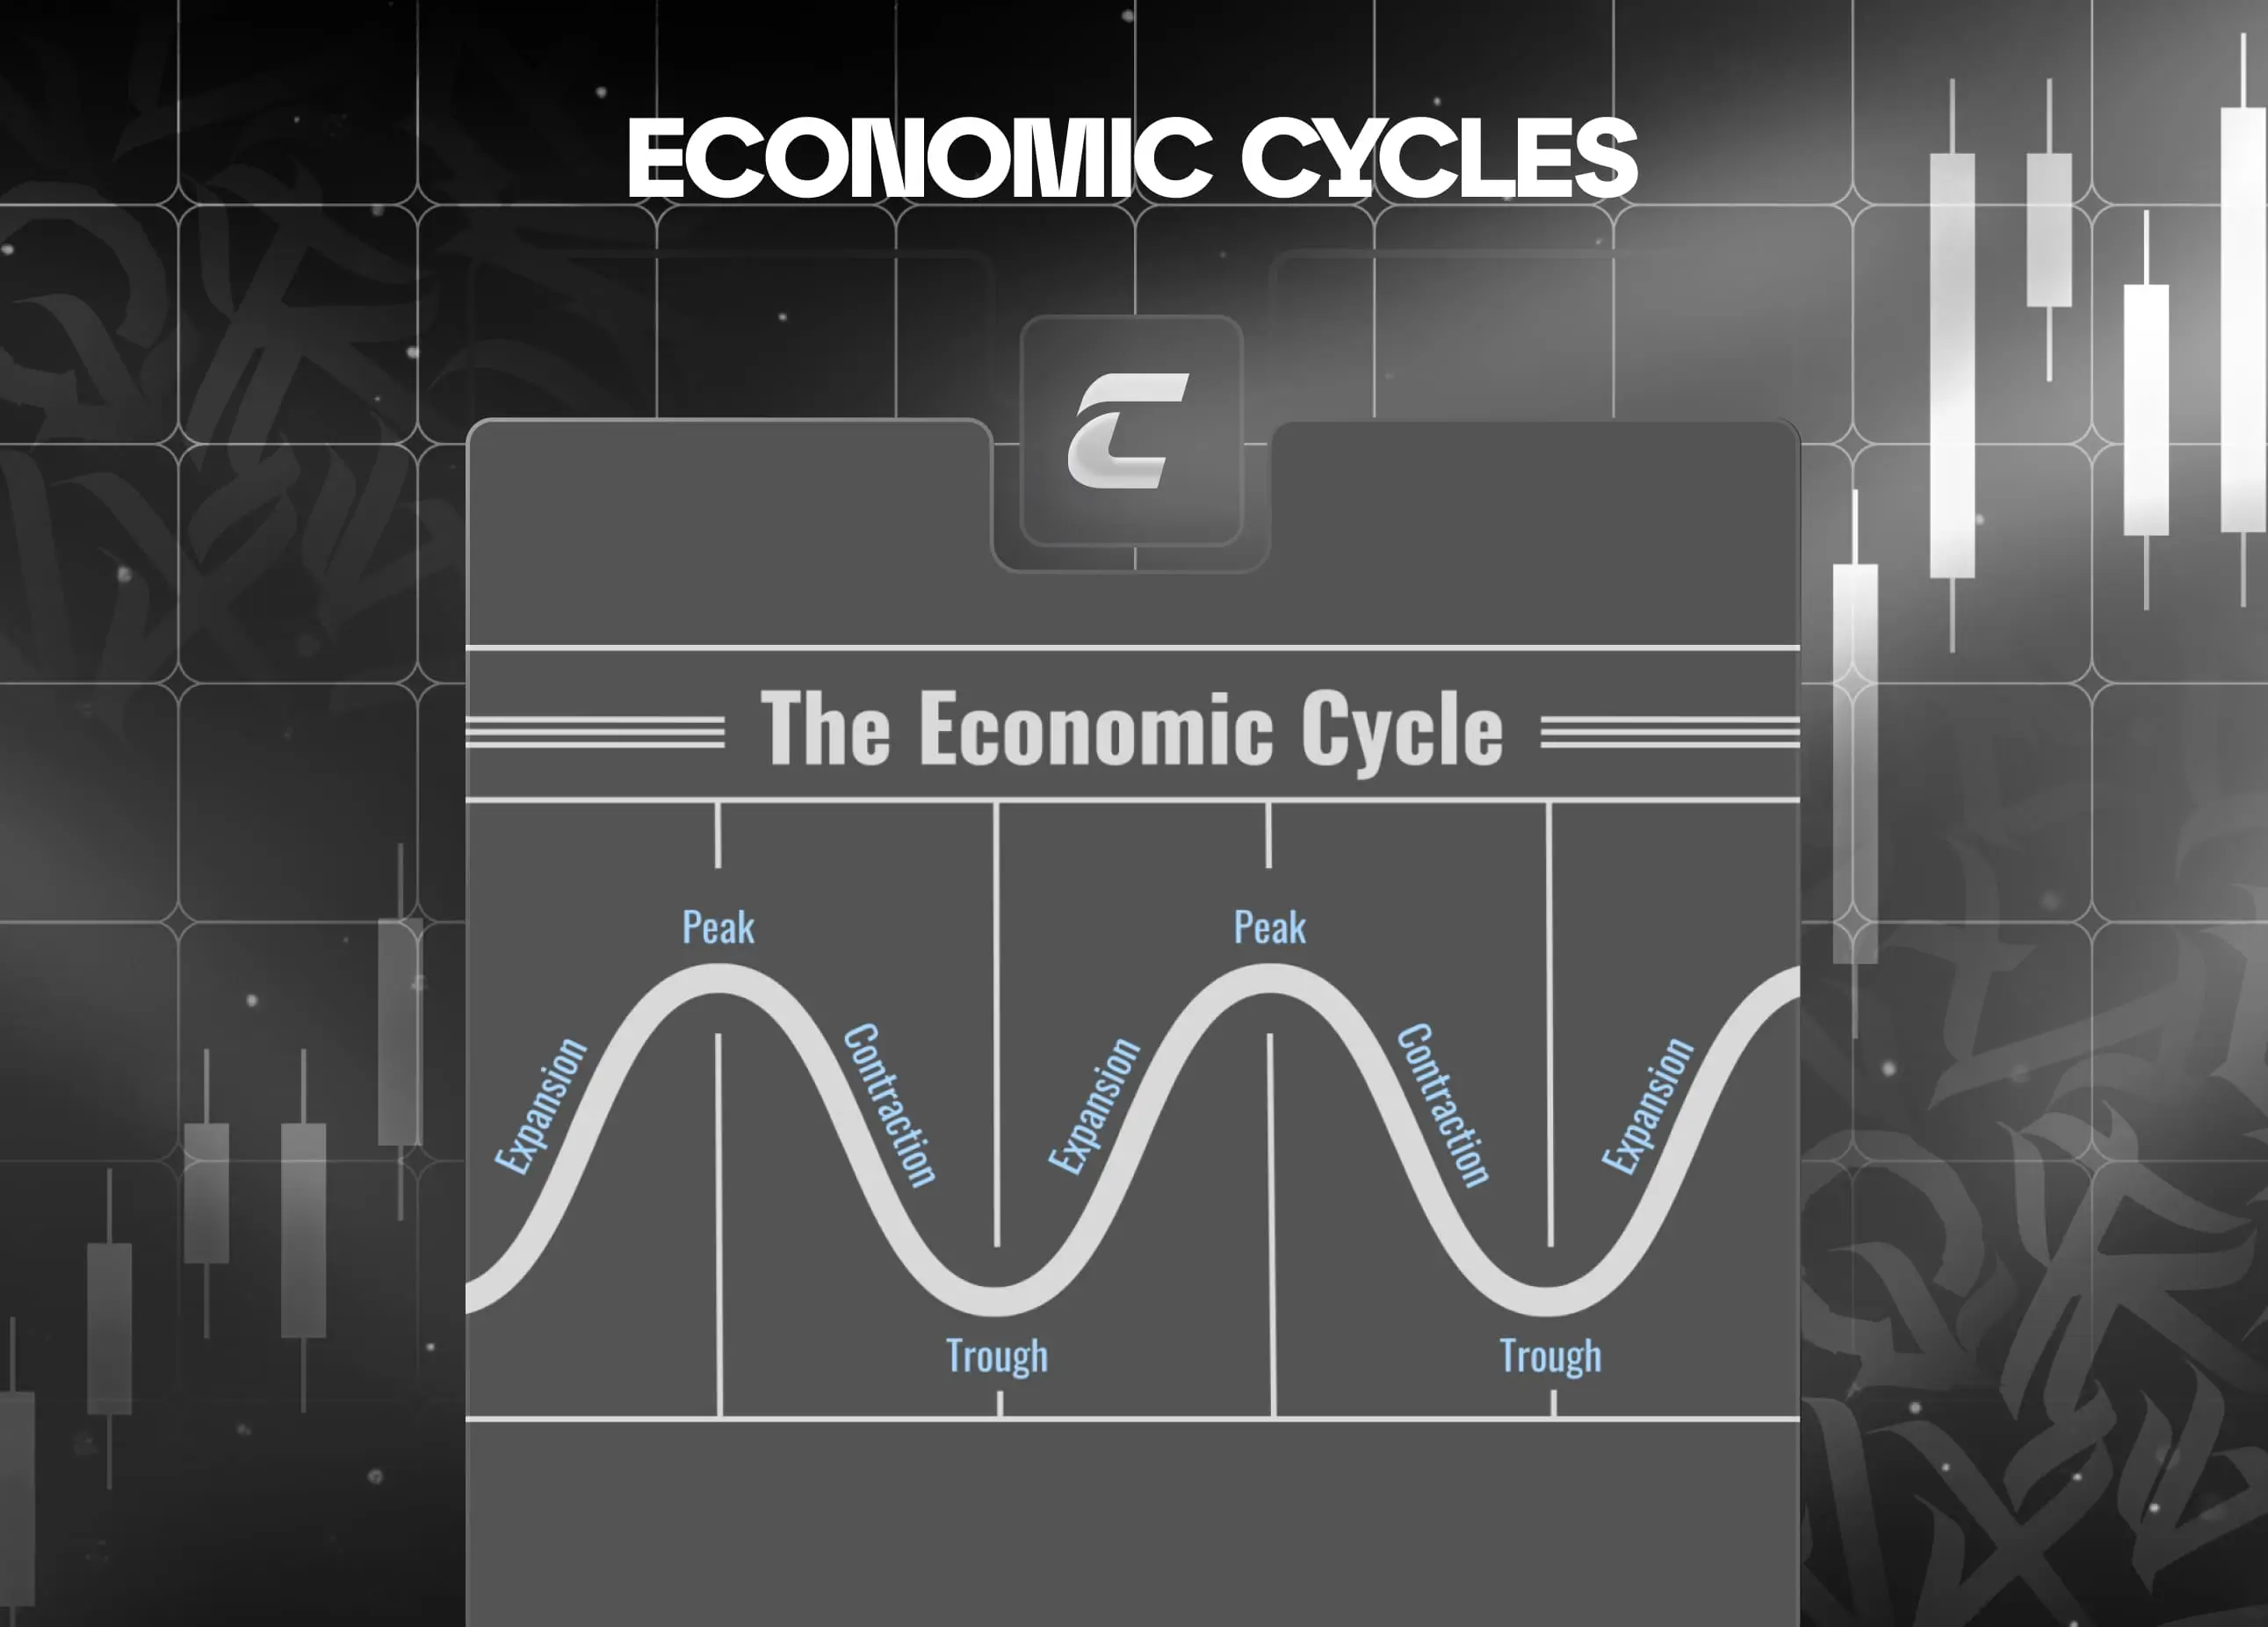
Since its inception, the S&P 500 has undergone constant changes in the composition of companies. Some companies have become more important and influential while others have lost ground. These changes reflected economic and structural transformations in the US. The performance of the S&P 500 Index was influenced by a variety of factors, including economic cycles, political events, and technological innovation.
The index reflected important economic events such as the Great Depression in the 1930s, the post-World War II era, the dot-com bubble in the late 1990s, and the 2008 financial crisis. In each of these periods, the index rose and fell, reflecting the turbulence and recovery of the U.S. economy.
The most significant jumps in the index were seen during the following events:
- The 1968 Revolution: the index rose 27%.
- The 1973 oil crisis: the index fell 45%.
- Reagan's reforms: the index rose 160%.
- The dot-com bubble: the index rose 490%.
- The 2008 financial crisis: the index fell 56%.
- The response to the COVID-19 pandemic: the index rose 100%.
As technology, innovation, and new industries emerged, the S&P 500 continued to evolve. In the late 20th century-early 21st, technology companies such as Apple, Amazon, and Google became important components of the index. The fastest growing company in the S&P 500 index is Amazon. The company was included in the index in 1999 when it had a market capitalization of about $20 billion. By 2023, its market capitalization exceeded $1.5 trillion.
The history of the S&P 500 index from inception to 2016 in an infographic
As of May 22, 2024, the index has reached $5,321.
Criteria for inclusion of companies in the index
Currently, companies included in the S&P 500 Index are required to meet certain standards. The main criteria are monthly capitalization and the volume of shares traded on the open market. To be included in the S&P 500 Index, companies must meet the following requirements:
Capitalization of at least $8.2 billion:
- Companies, to be counted in the index, must have a market capitalization of at least $8.2 billion. This reflects the total value of all their traded shares in the market.
The minimum trading volume is 250,000 shares per month:
- In addition to capitalization, companies must have sufficient trading volume, expressed as a minimum of 250 thousand shares per month. This ensures sufficient liquidity and activity in the market.
In addition, the companies in the index must be publicly listed, meaning their shares must be traded on the stock exchange. Even if there are private companies with higher capitalization, but their shares are not traded on the public market, they cannot be included in the index. Also, for a company's stock to be considered for inclusion in the S&P 500 index, it must have been traded for at least 6 months after its initial public offering (IPO). Also, that company must have been profitable in the last four quarters. The company must have sufficient liquidity and financial strength, which emphasizes its ability to function in the market for an extended period of time. These criteria aim to ensure the reliability and stability of the companies included in the index, which in turn maintains investor confidence and makes the index a representative reflection of the U.S. business segment.
The youngest company in the S&P 500 index is Tesla. The company was added to the index in 2020, when it had a market capitalization of about $50 billion. By 2023, its market capitalization exceeded $700 billion.
Tesla Logarithmic Chart as of 05/22/2024
The composition of the S&P 500 Index is reviewed quarterly. Companies that no longer meet the criteria for inclusion in the index are replaced by companies that meet them. Over the history of the S&P 500 Index, more than 1,000 companies have been included and excluded from the index.
As of today, the most recent company excluded from the S&P 500 Index is General Electric.
General Electric
The company was delisted from the index on May 31, 2023 after it was split into three independent companies, GE Healthcare, GE Power and GE Renewable Energy.
Companies are excluded from the S&P 500 Index for various reasons, including:
- Failure to meet index inclusion criteria.
- Merger or acquisition.
- Bankruptcy.
- Decrease in market capitalization to below $11.2 billion.
- Reduction of annual trading turnover to below $250 million.
- Reduction in free float to below 10%.
- Non-profitability within the last four quarters.
- Non-compliance with S&P Dow Jones Indices disclosure standards.
S&P 500 vs Dow Jones
The S&P 500 and Dow Jones Industrial Average (Dow) indices are two of the best-known indices of the U.S. stock market. However, the S&P 500 Index is considered a more reliable stock market indicator than the Dow Jones Industrial Average. Why is this so?
First, the Dow Jones index is limited to only 30 companies. For example, it does not include Amazon, Alphabet, and Berkshire Hathaway.
Second, the Dow Jones Index is price-weighted, which means that companies' exposure to the index is determined by their stock price, not their market capitalization. This can lead to distortion because companies with more expensive stocks have a greater weight in the index. For example, Goldman Sachs' $238 stock has twice as much influence as Walmart's, despite the significant difference in their market capitalization.
The S&P 500 index, on the other hand, covers many more companies, making it a more complete reflection of the market. The valuation of these companies is based on their market capitalization, which is considered a more logical method of determining their contribution to the overall performance of the stock market.
The importance of the S&P 500 to investors
The S&P 500 Index is an important tool for investors and is a key indicator of the financial market in the United States. Let's take a closer look at why this index is so important to investors:
- Broad market reflection: the S&P 500 includes the 500 largest U.S. companies, covering a wide range of sectors, which we previously looked at in more detail. Investors can use it to get a sense of the overall health of the U.S. stock market. A rising index can signal stability and investor confidence, as well as positive economic development, while a falling index can signal possible problems or instability.
- Representativeness of different sectors: the index includes companies from different industries. If you are interested in a particular sector, you can look at the position of the companies you are interested in on the S&P 500 list.
- Liquidity and tradability: The S&P 500 is among the most liquid and widely traded indices, making it attractive to those who prefer easy access to the market.
Advantages and disadvantages of the S&P 500
Advantages of the index:
- Broad market coverage: the S&P 500 includes the 500 largest U.S. companies from a variety of industries. This provides a broad and comprehensive reflection of the U.S. stock market.
- Liquidity and trading: The S&P 500 is one of the most liquid indices, which ensures ease of trading. Investors can easily buy and sell financial instruments related to this index.
- Long-term returns: historically, the S&P 500 index has a long history of growth. Over the past 100 years, the index has grown at an average of 10% per year.
Disadvantages of the index:
- Influence of large companies: larger companies with higher capitalization have a greater impact on the index, which can lead to sector bias.
- Does not consider other markets: the S&P 500 focuses solely on the U.S. market and does not provide a comprehensive view of the global economy.
- Over-concentration in sectors: The index can be highly concentrated in a few sectors, especially if those sectors are booming.
How to invest in the S&P 500
ETFs on the S&P 500 Index represent a convenient and most affordable investment vehicle. Such ETFs are traded on various exchanges around the world, but are particularly active on the largest venue, the NYSE Arca. The most popular and widely traded ETF on the S&P 500 Index is the SPDR S&P 500 ETF Trust (SPY). Purchasing ETF shares is similar to buying other securities on the exchange and only requires opening a brokerage account.
Importance of the S&P 500 Index: CRYPTOLOGY.KEY team's opinion
The S&P 500 Index plays a key role for traders and investors by providing a broad understanding of the current state and possible trends in the U.S. economy.
The index reflects the overall economic climate as it represents a wide range of sectors, including technology, healthcare, financials and consumer staples, allowing market participants to gain an in-depth understanding of the state and outlook of the economy.
It is interesting to note that the S&P 500 Index can continue to rise even when the economy is on the brink of recession. This phenomenon is due to a number of factors.
First, the index reflects not only the current state of the economy, but also investors' expectations about the future. Investors may continue to invest in stocks expecting future growth despite the current economic difficulties.
Second, many of the companies in the index are global and can maintain strong returns even as the U.S. economy slows due to their operations in other markets. Like, for example, the index's top 5 companies by weight: Microsoft, Apple, NVIDIA, Amazon, and Meta, each company's stock has gained between 17% and 340% over the past year, pulling the entire market and thus the price of the entire S&P500 index.
In addition, when investors lose confidence in fiat currencies like the dollar, they diversify their risk by investing in other assets, such as company stocks.
Thus, the S&P 500 index is not just a reflection of the current state of the economy, but also an indicator of investor expectations and strategies. Analyzing the index is important even if you trade other financial markets. For example, a rise in the index can signal a strengthening economy and an increase in investor risk appetite, which is often accompanied by an increased interest in riskier assets, including cryptocurrencies. On the other hand, a drop in the index could indicate increased economic uncertainties or negative trends, which could affect cryptocurrency rates, especially if investors begin to avoid riskier assets.
Nevertheless, despite the possible volatility, according to statistics, the S&P 500 index has been growing at 12.46% per year for the last 10 years. That is, it is not a bad investment tool that brings a stable income every year. If you want to find the best time to invest in the S&P 500, read our Weekly Plan, because there we analyze the charts of the most popular assets of the stock, forex and crypto markets.
Frequently asked questions about the S&P 500
What is the S&P 500?
How does the S&P 500 stand for?
How can a company get into the S&P 500?
Which is better: the S&P 500 or the Dow Jones Industrial Average (Dow)?
Trading